










Capri Q2 FY27 PAT rises 77% as cost-income hits 41.4%
Key highlights
- Capri’s Q2 FY27 profit after tax rose 77% year on year to ₹418.3 crore.
- Capri’s assets under management increased 62% year on year to ₹43,878 crore in Q2 FY27.
- Capri’s Q2 FY27 net interest margin reached 9.6%, compared with 8.6% in FY26.
- Capri’s Q2 FY27 cost-income ratio fell to 41.4% from 49.4% a year earlier.
powered by IRIS
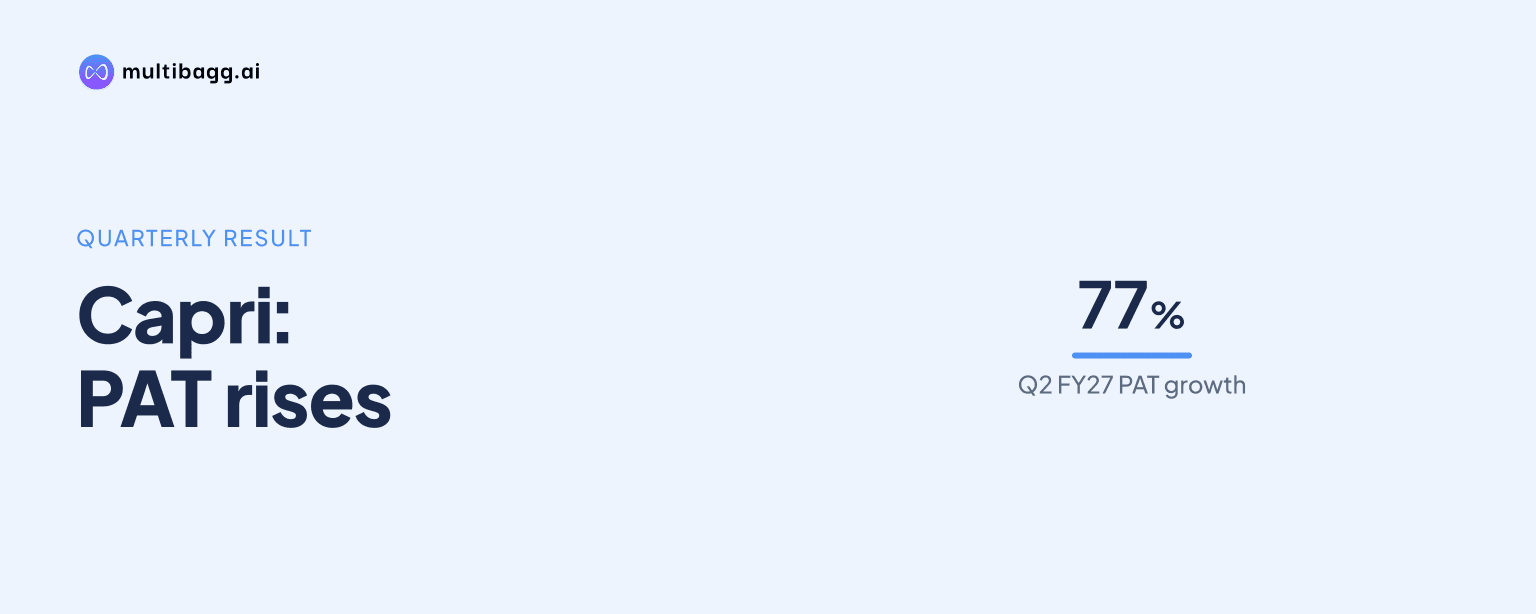
Capri Global reported profit after tax of ₹418.3 crore in Q2 FY27, up 77% year on year, as net interest margin reached 9.6% and the cost-income ratio fell 807 basis points to 41.4%. Assets under management rose 62% to ₹43,878 crore, while annualised return on average equity reached 21.6%.
Know Capri Global Capital inside out
Results, valuation, peers and who's buying, in one view.
How did Capri’s Q2 FY27 earnings change?
Capri’s Q2 FY27 profit after tax rose 77% year on year to ₹418.3 crore, while operating profit increased 84% to ₹636.3 crore. Net interest income rose 69% to ₹812.5 crore and non-interest income rose 34% to ₹273 crore, taking net total income to ₹1,085.4 crore from ₹683 crore in Q2 FY26.
The quarterly trend also moved higher from Q1 FY27. Profit after tax increased from ₹353.4 crore in Q1 FY27 to ₹418.3 crore in Q2 FY27, operating profit rose from ₹532.1 crore to ₹636.3 crore, and net interest income advanced from ₹736.4 crore to ₹812.5 crore.
For H1 FY27, Capri reported profit after tax of ₹771.7 crore, up 88% from ₹410.9 crore in H1 FY26. Net interest income rose 74% to ₹1,548.8 crore and operating profit increased 78% to ₹1,168.3 crore during the six-month period.
Why did Capri’s margins widen in Q2 FY27?
Capri’s net interest margin rose to 9.6% in Q2 FY27 from 8.6% in FY26, supported by a 17.5% yield on net advances and a 9.2% cost of borrowings. Its reported spread, calculated as yield on advances less cost of borrowings, expanded to 8.3% from 6.9% in FY26.
Product yields showed differences across the portfolio in Q2 FY27. Gold loans carried a 19.1% yield, retail construction finance 18.6%, MSME 16.7% and housing finance 13.7%. Gold-loan yield rose from 17.8% in FY26 and housing yield from 13.2%, while MSME yield remained at 16.7%.
The asset mix added more gold and construction-finance exposure. Gold-loan assets under management rose from ₹16,964.6 crore in FY26 to ₹21,003.8 crore in Q2 FY27, while construction finance increased from ₹5,708.1 crore to ₹7,502.8 crore. Housing assets under management reached ₹8,325.3 crore and MSME reached ₹7,015.5 crore; Capri defines MSME as including MSME, micro loan against property and solar loans.
How did Capri improve operating efficiency?
Capri’s cost-income ratio declined to 41.4% in Q2 FY27 from 49.4% in Q2 FY26 and 44.0% in Q1 FY27. Operating expenses increased 33% year on year to ₹449.2 crore, a lower rate than the 59% increase in net total income to ₹1,085.4 crore.
Annualised operating expenses as a percentage of average total assets fell to 4.7% from 5.7% in Q2 FY26. Cost excluding co-lending income as a percentage of average assets under management also declined to 4.3% from 5.2%, while employee costs represented 69% of operating expenses and other operating expenditure accounted for 31%.
Capri attributed the efficiency trend to productivity gains and targeted technology integration. The presentation says its cost-income ratio increased to 63.4% in FY23 and 66.7% in FY24 because of investment in technology, branches and employees, before falling to 59.9% in FY25 and 49.4% in FY26.
Got a follow-up? Ask IRIS
What do Capri’s returns and credit costs show?
Capri’s annualised return on average equity rose to 21.6% in Q2 FY27 from 14.4% in Q2 FY26 and 19.1% in Q1 FY27. Annualised return on average assets increased to 4.4%, compared with 4.0% a year earlier and 4.1% in the preceding quarter; Capri calculates return on average equity using average beginning and ending equity.
Credit costs increased alongside the higher returns. Q2 FY27 credit cost was ₹79.3 crore, or 0.8% of average total assets on an annualised basis, compared with ₹31.2 crore and 0.5% in Q2 FY26. Capri defines credit cost as write-offs plus expected credit loss provisions, while net non-performing assets were 0.8%, up 9 basis points year on year.
Balance-sheet ratios changed as assets expanded. Debt-to-equity rose to 3.8 times in Q2 FY27 from 2.5 times in Q2 FY26, while standalone capital-to-risk-weighted-assets ratio declined to 22.7% from 32.9%. Book value per share increased from ₹69.4 to ₹82.8 and quarterly earnings per share rose from ₹2.5 to ₹4.3.
What is Capri planning after Q2 FY27?
Capri plans to add 750 to 800 branches over the next two years in existing and new states, including Telangana, Karnataka, Tamil Nadu, Andhra Pradesh, Orissa and Uttar Pradesh. Management also plans to deploy Agentic artificial intelligence tools for cost efficiency, productivity and customer experience, alongside efforts to raise sales productivity in MSME, housing and gold lending.
Management has set an assets-under-management target of ₹65,000 crore by FY28 and more than ₹1,25,000 crore by FY31, with stated compound annual growth of 28% to 30%. Its plan includes customised products for underserved markets, cross-selling, expansion of insurance and car-loan distribution, and additional fee-income verticals.
Capri also plans to diversify borrowings through non-convertible debentures and commercial paper, widen its lender base and develop co-lending partnerships. Total funding was ₹39,570 crore in Q2 FY27, comprising 53% bank funding, 23% co-lending or direct assignment and 14% market borrowings; new credit facilities sanctioned in the quarter were ₹4,427.6 crore.
Conclusion
Capri’s Q2 FY27 figures show earnings rising faster than operating expenses, with ₹418.3 crore of profit after tax, ₹636.3 crore of operating profit and a 41.4% cost-income ratio. Higher net interest margin, a 62% increase in assets under management and annualised return on average equity of 21.6% accompanied that operating outcome.
The next disclosed milestones are execution of the planned 750 to 800 branch additions over two years and progress toward management’s ₹65,000 crore assets-under-management target for FY28. Funding diversification and co-lending expansion are also relevant to monitor, while Q2 FY27 credit cost rose to 0.8% of average assets and net non-performing assets stood at 0.8%.