










Gabion Technologies’ FY26 debt-equity ratio fell to 0.77
Key highlights
- Gabion Technologies reported a debt-equity ratio of 0.77 in FY26, versus 2.37 in FY24.
- Gabion Technologies reported FY26 ROE of 14.2%, down from 37.5% in FY24.
- Gabion Technologies’ total equity rose to Rs 57.009 crore at March 2026 from Rs 22.296 crore at March 2025.
- Gabion Technologies reported net operating cash outflow of Rs 5.686 crore in H1 FY27.
powered by IRIS
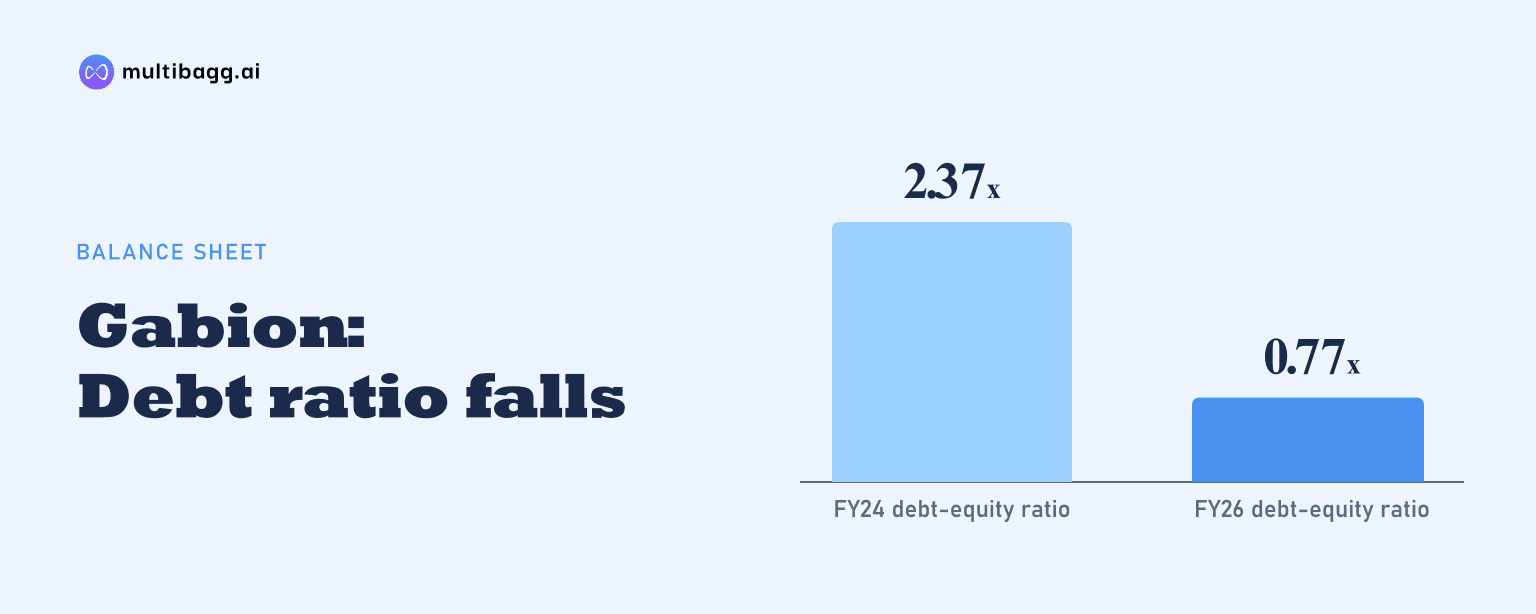
Gabion Technologies India Limited reported a debt-equity ratio of 0.77 in FY26, down from 2.37 in FY24, while return on equity (ROE) declined to 14.2% from 37.5% and return on capital employed (ROCE) fell to 15.9% from 21.8%.
Know Gabion Technologies India inside out
Results, valuation, peers and who's buying, in one view.
Why did Gabion Technologies’ debt-equity ratio decline?
Gabion Technologies’ reported debt-equity ratio declined by 1.60 points from 2.37 in FY24 to 2.11 in FY25 and 0.77 in FY26. The presentation does not disclose the formula used for debt-equity or provide an FY24 balance sheet, so it does not specify the separate contribution of borrowings, equity or other adjustments to the ratio’s decline.
The reported balance sheet shows a substantial increase in equity between March 2025 and March 2026. Total equity rose to Rs 57.009 crore from Rs 22.296 crore, while share capital increased to Rs 13.575 crore from Rs 9.975 crore and reserves and surplus rose to Rs 43.266 crore from Rs 12.163 crore.
Over the same March 2025 to March 2026 period, long-term borrowings declined to Rs 17.495 crore from Rs 18.473 crore and short-term borrowings declined to Rs 26.083 crore from Rs 28.240 crore. The combination of lower reported borrowings and higher equity provides balance-sheet context for the lower FY26 debt-equity ratio, although the presentation does not reconcile the ratio calculation.
How did Gabion Technologies’ balance sheet change by September 2026?
Gabion Technologies’ total assets increased to Rs 141.069 crore at September 2026 from Rs 122.511 crore at March 2026. Total equity rose by Rs 5.676 crore to Rs 62.685 crore, as reserves and surplus increased to Rs 48.837 crore while share capital remained unchanged at Rs 13.575 crore.
Borrowings increased in the six months to September 2026. Long-term borrowings rose to Rs 21.075 crore from Rs 17.495 crore at March 2026, while short-term borrowings rose to Rs 32.994 crore from Rs 26.083 crore. The FY26 debt-equity ratio is therefore an annual historical metric, and the presentation does not disclose an updated ratio for September 2026.
Current assets also increased to Rs 102.618 crore at September 2026 from Rs 88.928 crore at March 2026. Inventories rose by Rs 11.260 crore to Rs 46.760 crore, while trade receivables increased by Rs 1.090 crore to Rs 43.908 crore.
Why did Gabion Technologies’ return ratios fall despite higher FY26 profit?
Gabion Technologies’ ROE fell to 14.2% in FY26 from 26.1% in FY25 and 37.5% in FY24, despite higher profit after tax. Profit after tax increased by Rs 1.922 crore year on year to Rs 8.111 crore in FY26, while the profit after tax margin increased to 7.0% from 6.2%.
ROCE also declined, to 15.9% in FY26 from 19.2% in FY25 and 21.8% in FY24. The increase in total equity to Rs 57.009 crore at March 2026 from Rs 22.296 crore a year earlier provides context for the lower reported ROE, but the presentation does not state the formula used for ROE or ROCE or assign the changes to a particular asset or liability item.
FY26 revenue from operations rose 14.8% to Rs 115.197 crore from Rs 100.364 crore in FY25. Earnings before interest, tax, depreciation and amortisation, or EBITDA, increased to Rs 17.399 crore from Rs 14.476 crore, but the reported return ratios moved lower over the same period.
Got a follow-up? Ask IRIS
Did Gabion Technologies’ operating margins improve in FY26?
Gabion Technologies’ EBITDA and profit after tax margins improved in FY26, while gross profit margin declined. EBITDA margin increased to 15.1% in FY26 from 14.4% in FY25, and profit after tax margin rose to 7.0% from 6.2%.
Gross profit increased to Rs 38.270 crore in FY26 from Rs 34.995 crore in FY25, but gross profit margin declined to 33.2% from 34.9%. Direct expenses rose to Rs 25.799 crore from Rs 20.501 crore, while cost of material consumed increased to Rs 59.310 crore from Rs 52.335 crore.
Finance cost increased to Rs 4.768 crore in FY26 from Rs 4.604 crore in FY25. Even so, earnings before interest and tax margin rose to 14.0% from 13.6%, and profit after tax increased to Rs 8.111 crore from Rs 6.189 crore.
In H1 FY27, the detailed income statement reported revenue from operations of Rs 71.528 crore, EBITDA of Rs 10.266 crore and a 14.4% EBITDA margin. It reported profit after tax of Rs 5.413 crore and a 7.6% margin, while the key-metrics page lists H1 FY27 EBITDA of Rs 10.277 crore and profit after tax of Rs 5.424 crore.
How did working capital affect Gabion Technologies’ H1 FY27 cash flow?
Gabion Technologies reported net cash used in operating activities of Rs 5.686 crore in H1 FY27, compared with net cash generated from operating activities of Rs 4.325 crore in FY26. The periods are not directly comparable because H1 FY27 covers six months while FY26 covers a full year.
Changes in working capital used Rs 13.948 crore in H1 FY27, compared with Rs 6.184 crore used in FY26. Operating profit before working-capital changes was Rs 10.349 crore in H1 FY27, but cash generated or used from operations was negative Rs 3.599 crore before income taxes and interest paid of Rs 2.087 crore.
Cash and cash equivalents were Rs 4.2 lakh at September 2026, down from Rs 9.3 lakh at March 2026. H1 FY27 financing activities generated Rs 10.491 crore, while investing activities used Rs 4.857 crore and the net decrease in cash was Rs 5.2 lakh.
Conclusion
Gabion Technologies’ FY26 record combines a lower reported debt-equity ratio, higher revenue and improved EBITDA and profit after tax margins with lower ROE and ROCE. The debt-equity ratio fell from 2.37 in FY24 to 0.77 in FY26 as total equity rose to Rs 57.009 crore at March 2026, while FY26 profit after tax reached Rs 8.111 crore.
The next reported period should show whether the Rs 13.948 crore H1 FY27 working-capital outflow moderates after inventories reached Rs 46.760 crore and receivables reached Rs 43.908 crore at September 2026. The presentation discloses no debt-reduction target or updated September 2026 debt-equity ratio, and its H1 FY27 summary and detailed income-statement figures differ slightly for EBITDA and profit after tax.