










Gabion Technologies H1 FY27 PAT rose 123.6% on revenue
Key highlights
- Gabion Technologies reported H1 FY27 revenue of Rs 71.528 crore, up 76.2% year on year.
- Gabion Technologies reported H1 FY27 PAT of Rs 5.424 crore in its detailed income statement, up 123.6% year on year.
- Gabion Technologies' PAT margin rose 160 basis points year on year to 7.6% in H1 FY27.
- Gabion Technologies reported negative operating cash flow of Rs 5.686 crore for the six months to September 2026.
powered by IRIS
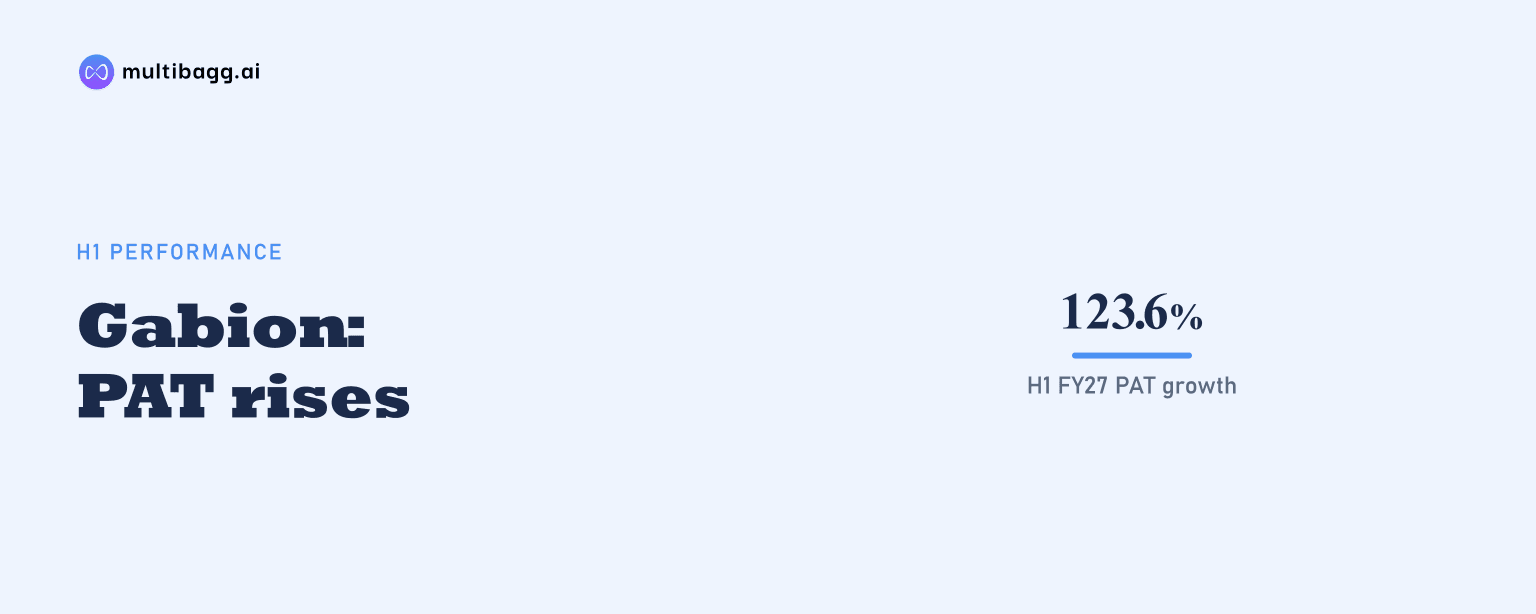
Gabion Technologies India Ltd. reported H1 FY27 revenue from operations of Rs 71.528 crore, up 76.2% year on year, while profit after tax rose 123.6% to Rs 5.424 crore in its detailed income statement. PAT margin increased 160 basis points to 7.6%, despite gross margin declining 250 basis points to 32.3%.
Know Gabion Technologies India inside out
Results, valuation, peers and who's buying, in one view.
How did Gabion Technologies perform in H1 FY27?
Gabion Technologies recorded Rs 71.528 crore of revenue from operations in H1 FY27, compared with Rs 40.588 crore in H1 FY26, an increase of Rs 30.940 crore. Earnings before interest, tax, depreciation and amortisation, or EBITDA, rose 78.5% to Rs 10.277 crore from Rs 5.752 crore over the same period.
Gabion Technologies reported PAT of Rs 5.424 crore in the detailed H1 FY27 income statement, against Rs 2.421 crore in H1 FY26. The financial-highlights page lists PAT of Rs 5.413 crore for H1 FY27 while also stating 123.6% growth; the detailed statement is the source for the Rs 5.424 crore figure used here. Profit before tax increased 201.3% to Rs 7.305 crore from Rs 2.421 crore.
What happened to Gabion Technologies' margins?
Gabion Technologies' gross profit margin was 32.3% in H1 FY27, down from 34.8% in H1 FY26, a decline of 250 basis points. Gross profit nevertheless increased 63.8% to Rs 23.119 crore from Rs 14.112 crore as revenue rose by 76.2%.
EBITDA margin rose to 14.4% from 14.2%, while PAT margin increased to 7.6% from 6.0%. Employee benefit expense increased to Rs 7.631 crore from Rs 5.789 crore, and other expense rose to Rs 5.211 crore from Rs 2.572 crore. EBITDA growth of 78.5% was therefore 2.3 percentage points above revenue growth.
Gabion Technologies' margins were lower or unchanged relative to H2 FY26. Gross margin of 32.3% was 10 basis points below H2 FY26's 32.4%, while EBITDA margin was 120 basis points below 15.6%. PAT margin was unchanged at 7.6%, although PAT declined 4.9% from Rs 5.691 crore in H2 FY26.
Why did Gabion Technologies' PAT increase faster than revenue?
Gabion Technologies' PAT growth exceeded revenue growth as reported EBITDA, earnings before interest and tax, or EBIT, and PAT margins improved year on year, while finance cost declined. Finance cost was Rs 2.087 crore in H1 FY27, compared with Rs 2.5175 crore in H1 FY26, and EBIT increased 88.4% to Rs 9.606 crore from Rs 5.092 crore.
Other income increased to Rs 16.9 lakh from Rs 12.4 lakh, while depreciation and amortisation rose to Rs 84 lakh from Rs 78.4 lakh. Exceptional items were Rs 21.3 lakh in H1 FY27, compared with Rs 15.3 lakh in H1 FY26. Tax was Rs 1.881 crore in H1 FY27, whereas the H1 FY26 income-statement table records Rs 0 tax.
The income statement shows growth accelerating after gross profit: gross profit rose 63.8%, EBITDA rose 78.5%, EBIT rose 88.4%, and PAT rose 123.6%. This sequence identifies the reported progression through the income statement, but the presentation does not assign a single cause for the PAT increase.
How did Gabion Technologies compare with H2 FY26?
Gabion Technologies' H1 FY27 revenue was 4.1% below H2 FY26, showing that the year-on-year expansion did not continue on a half-on-half basis. Revenue declined to Rs 71.528 crore from Rs 74.608 crore, gross profit fell 4.3% to Rs 23.119 crore, and EBITDA declined 11.9% to Rs 10.277 crore.
EBIT was Rs 9.606 crore, down 12.9% from Rs 11.019 crore in H2 FY26, while profit before tax was 16.6% lower at Rs 7.305 crore. Finance cost declined to Rs 2.087 crore from Rs 2.2501 crore. Earnings per share were 4.00 in H1 FY27, compared with 4.07 in H2 FY26 and 2.43 in H1 FY26.
Got a follow-up? Ask IRIS
What do Gabion Technologies' balance sheet and cash flow show?
Gabion Technologies had total assets of Rs 141.069 crore at September 2026, compared with Rs 122.511 crore at March 2026. Current assets rose to Rs 102.618 crore from Rs 88.928 crore, including inventories of Rs 46.760 crore versus Rs 35.500 crore and trade receivables of Rs 43.908 crore versus Rs 42.818 crore. Cash and cash equivalents declined to Rs 4.2 lakh from Rs 9.3 lakh.
Total equity increased to Rs 62.685 crore at September 2026 from Rs 57.009 crore at March 2026. Long-term borrowings rose to Rs 21.075 crore from Rs 17.495 crore, while short-term borrowings increased to Rs 32.994 crore from Rs 26.083 crore. Total current liabilities were Rs 55.636 crore, up from Rs 46.395 crore.
Net cash from operating activities was negative Rs 5.686 crore in the six months to September 2026, compared with negative Rs 1.974 crore in the six months to September 2025. Operating profit before working-capital changes rose to Rs 10.349 crore from Rs 5.642 crore, but working-capital changes were negative Rs 13.948 crore versus negative Rs 5.098 crore. Financing activities generated Rs 10.491 crore and investing activities used Rs 4.857 crore.
What growth avenues does Gabion Technologies identify?
Gabion Technologies identifies mining and industrial projects, larger government works, export markets, and North-East and South Asia as growth avenues. Its presentation describes ash ponds and industrial works as a new business line, and says rockfall and slope stabilisation remains its largest and fastest-growing application.
Management says higher post-initial-public-offering net worth expands bid capacity for larger government works, supported by a dedicated Bid Desk for direct tenders. The presentation also says its Assam unit supports the North-East, Nepal and Bangladesh subsidiaries extend regional reach, and Bhutan Standards certification has been obtained while ETA and CE marking are under way for export-market access.
Conclusion
Gabion Technologies delivered faster year-on-year PAT growth than revenue in H1 FY27, with PAT rising 123.6% and revenue increasing 76.2%. EBITDA and PAT margins improved from H1 FY26 even as gross margin declined, while comparisons with H2 FY26 show lower revenue, EBITDA and PAT in the latest half. The September 2026 balance sheet also showed higher inventories, borrowings and current liabilities, alongside negative operating cash flow.
The next disclosed developments to watch are management's plans for larger direct government tenders, ash-pond and industrial work, the Assam unit, and regional subsidiaries in Nepal and Bangladesh. Progress on ETA and CE marking for export access is also unresolved in the presentation, while future working-capital movements will remain relevant after negative operating cash flow of Rs 5.686 crore in the six months to September 2026.