










Glen FY26 revenue rose 19%, while profit and returns fell
Key highlights
- Glen's FY26 revenue rose 19% to Rs 203.1261 crore from Rs 170.6609 crore in FY25.
- Glen's FY26 PAT declined to Rs 16.5025 crore from Rs 18.2231 crore, and PAT margin fell to 8.04% from 10.65%.
- Glen's FY26 inventories were Rs 78.4152 crore and trade receivables were Rs 37.1727 crore, versus Rs 59.5901 crore and Rs 30.7054 crore in FY25.
- Glen's FY26 RONW declined to 11.82% from 31.17%, while debt-to-equity fell to 0.86 times from 2.27 times.
powered by IRIS
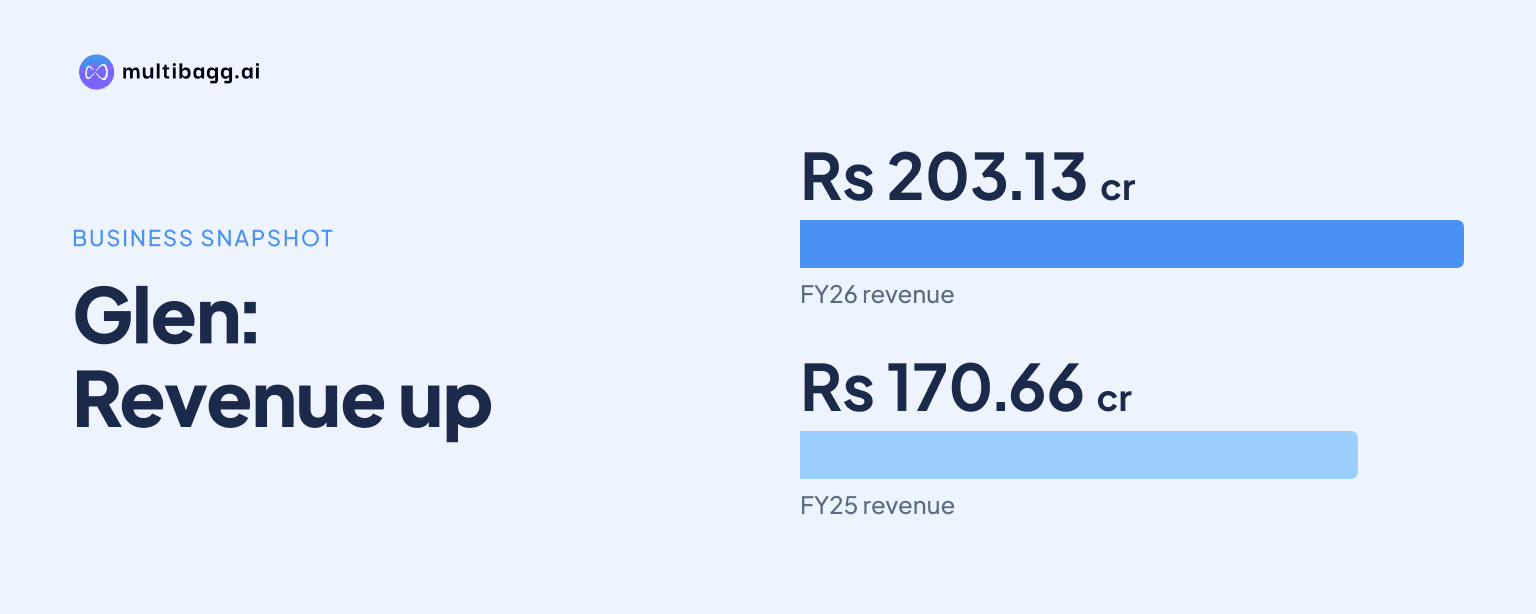
Glen Industries Limited reported FY26 revenue of Rs 203.1261 crore, up 19% from FY25, but profit after tax fell to Rs 16.5025 crore from Rs 18.2231 crore as reported EBITDA margin declined to 19.04% and return on net worth fell to 11.82%.
Know GLEN Industries inside out
Results, valuation, peers and who's buying, in one view.
Why did Glen's FY26 profit decline despite higher revenue?
Glen's FY26 profit declined because total expenditure increased by Rs 35.7741 crore, exceeding the Rs 33.9815 crore increase in total income. Revenue increased to Rs 203.1261 crore in FY26 from Rs 170.6609 crore in FY25, while total income, which includes other income, rose to Rs 205.1586 crore from Rs 171.1771 crore.
Earnings before interest, tax, depreciation and amortisation, or EBITDA, was Rs 39.0675 crore in the FY26 consolidated profit and loss statement, down from Rs 40.8601 crore in FY25. Profit before tax declined to Rs 21.7232 crore from Rs 24.4467 crore, and profit after tax, or PAT, decreased by Rs 1.7206 crore to Rs 16.5025 crore. FY26 PAT nevertheless remained above FY24 PAT of Rs 8.5789 crore.
Glen's key-ratios page separately lists FY26 EBITDA of Rs 38.5039 crore, compared with Rs 39.0675 crore in the profit and loss statement. The reported FY26 EBITDA margin of 19.04% aligns with Rs 39.0675 crore divided by total income of Rs 205.1586 crore, so the presentation contains two different FY26 EBITDA amounts.
Which FY26 costs rose most for Glen?
Glen's largest cost increase was in raw materials, which rose by Rs 33.0581 crore to Rs 119.2874 crore in FY26 from Rs 86.2293 crore in FY25. This increase was larger than the Rs 32.4665 crore rise in revenue, while direct expenses declined by Rs 1.5914 crore to Rs 21.9963 crore.
Employee costs rose to Rs 15.1999 crore from Rs 12.3572 crore, and other expenses increased to Rs 9.6075 crore from Rs 8.1433 crore. Interest costs rose by Rs 0.3057 crore to Rs 9.3541 crore and depreciation increased by Rs 0.6259 crore to Rs 7.9901 crore, alongside the increase in operating expenditure.
Glen reported an EBITDA margin of 19.04% for FY26, down from 23.87% in FY25 but above 17.12% in FY24. Its PAT margin followed the same pattern, falling to 8.04% from 10.65% in FY25 while remaining above the FY24 margin of 5.94%.
Got a follow-up? Ask IRIS
How did Glen's working capital and funding mix change in FY26?
Glen's current assets increased to Rs 169.1987 crore in FY26 from Rs 103.7524 crore in FY25, led by a Rs 18.8251 crore increase in inventories to Rs 78.4152 crore. Trade receivables rose by Rs 6.4673 crore to Rs 37.1727 crore, while cash and bank balances increased to Rs 33.8007 crore from Rs 2.0654 crore.
Current liabilities rose to Rs 121.5622 crore from Rs 100.0513 crore. Short-term borrowings increased by Rs 14.1366 crore to Rs 98.0497 crore, and trade payables more than doubled to Rs 13.4236 crore from Rs 6.0268 crore; the presentation reports a current ratio of 1.39 times, compared with 1.04 times in FY25.
Glen's long-term borrowings fell to Rs 22.6784 crore in FY26 from Rs 48.9143 crore in FY25, while net worth rose to Rs 139.6104 crore from Rs 58.4619 crore. Fixed assets increased to Rs 120.3790 crore from Rs 108.1687 crore, and total assets reached Rs 290.7707 crore compared with Rs 214.3624 crore a year earlier.
Why did Glen's return ratios and per-share earnings fall?
Glen's return on net worth, or RONW, fell to 11.82% in FY26 from 31.17% in FY25 and 32.19% in FY24. Return on capital employed, or ROCE, declined to 11.88% from 17.32% in FY25, alongside the reduction in PAT to Rs 16.5025 crore and the increase in net worth to Rs 139.6104 crore.
Earnings per share declined to Rs 6.91 in FY26 from Rs 10.39 in FY25, while PAT declined by 9% year on year. Net asset value per share, stated by Glen on a post-bonus basis, increased to Rs 54.71 from Rs 33.30 over the same period.
The debt-to-equity ratio decreased to 0.86 times in FY26 from 2.27 times in FY25 and 1.98 times in FY24. This change coincided with lower long-term borrowings of Rs 22.6784 crore, higher short-term borrowings of Rs 98.0497 crore, and a higher reported net worth.
What does Glen plan to invest in next?
Glen says it plans to invest Rs 100.49 crore in new manufacturing facilities and production lines under its strategic growth roadmap. Management says the programme is intended to enhance automation, improve operational efficiency and cost competitiveness, while expanding technological capabilities.
The roadmap also identifies diversification of product categories, a broader customer base and recyclable or biodegradable materials as initiatives. The presentation does not state a completion date, funding source or expected financial contribution for the Rs 100.49 crore manufacturing investment.
Conclusion
Glen's FY26 figures show revenue rising to Rs 203.1261 crore while expenditure growth reduced EBITDA, profit before tax and PAT from FY25 levels. Margins, RONW, ROCE and earnings per share also declined, even as the balance sheet recorded higher net worth, fixed assets, inventories, receivables and cash.
The next disclosed item to watch is Glen's Rs 100.49 crore plan for manufacturing facilities and production lines. Future disclosures can indicate the project's timing and funding, as well as whether the additions affect fixed assets, borrowings, working capital, EBITDA margin and return ratios.