










GLEN H1 FY27 profit rises 31% as revenue grows 21% year on year
Key highlights
- GLEN reported H1 FY27 PAT of Rs 10.9097 crore, up 31% from Rs 8.3055 crore in H1 FY26.
- Revenue rose 21% to Rs 115.2983 crore in H1 FY27 from Rs 95.5580 crore.
- Interest costs declined by Rs 0.5384 crore to Rs 4.2859 crore, while EBITDA rose to Rs 22.7069 crore.
- Thin-wall containers accounted for 80.75% of H1 FY27 revenue and exports represented 26.34%.
powered by IRIS
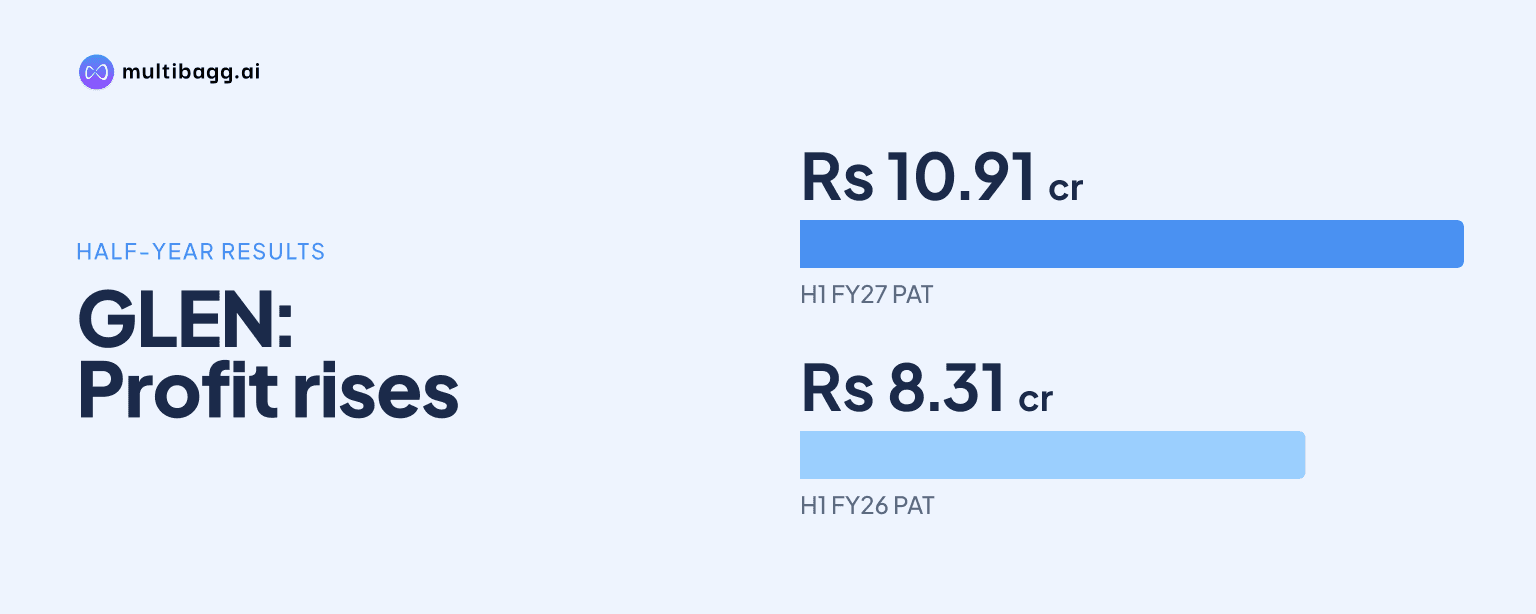
GLEN Industries Limited reported H1 FY27 profit after tax of Rs 10.9097 crore, up 31% year on year from Rs 8.3055 crore, as revenue rose 21% to Rs 115.2983 crore and interest costs declined to Rs 4.2859 crore. The company recorded the result alongside growth in domestic and export demand for its food-packaging products.
Know GLEN Industries inside out
Results, valuation, peers and who's buying, in one view.
What drove GLEN's H1 FY27 profit increase?
GLEN's H1 FY27 profit increase was driven by higher income and lower interest costs. Revenue rose by Rs 19.7403 crore to Rs 115.2983 crore from Rs 95.5580 crore in H1 FY26, while other income increased by Rs 0.1710 crore to Rs 1.1764 crore. As a result, total income increased by Rs 19.9112 crore to Rs 116.4747 crore from Rs 96.5635 crore.
Management said sustained demand for eco-friendly food-packaging solutions in domestic and export markets supported the H1 FY27 result. Profit before tax, or PBT, rose by Rs 3.1710 crore to Rs 14.2980 crore from Rs 11.1270 crore. Tax expense increased to Rs 3.3883 crore from Rs 2.8215 crore, but PAT still rose by Rs 2.6042 crore to Rs 10.9097 crore.
How did GLEN's operating profit compare with revenue growth?
GLEN's earnings before interest, tax, depreciation and amortisation, or EBITDA, rose 12% to Rs 22.7069 crore, compared with 21% revenue growth to Rs 115.2983 crore. EBITDA increased by Rs 2.5177 crore from Rs 20.1892 crore in H1 FY26. The difference between the rates of revenue and EBITDA growth reflects a larger increase in operating expenditure during the half year.
Total expenditure rose by Rs 17.3935 crore to Rs 93.7678 crore from Rs 76.3743 crore. Raw-material costs increased by Rs 12.9133 crore to Rs 78.0994 crore, employee costs rose by Rs 2.8201 crore to Rs 9.5984 crore, and other expenses increased by Rs 1.6601 crore to Rs 6.0700 crore. These three cost categories accounted for the reported expenditure increase.
Lower financing and depreciation charges helped PBT grow faster than EBITDA. Interest costs declined by Rs 0.5384 crore to Rs 4.2859 crore, while depreciation fell by Rs 0.1150 crore to Rs 4.1230 crore. The combined reduction of Rs 0.6534 crore in these charges came after EBITDA and before PBT, alongside the Rs 2.5177 crore EBITDA increase.
Got a follow-up? Ask IRIS
Which products and markets generated GLEN's H1 FY27 revenue?
GLEN generated 80.75% of H1 FY27 revenue from thin-wall containers, making this its largest disclosed product category. Polylactic acid, or PLA, straws accounted for 12.63% and paper straws contributed 6.62%. The presentation does not provide revenue amounts, sales volumes or H1 FY26 category percentages, so it does not show how the product mix changed from the prior half year.
Domestic sales represented 73.66% of H1 FY27 revenue, while exports represented 26.34%. Management linked the period's performance to demand in both markets and said GLEN serves customers in India and more than 30 countries. The presentation does not disclose H1 FY26 domestic or export percentages, preventing a year-on-year assessment of geographic mix.
GLEN said it shifted to food-grade packaging in 2019 and supplies thin-wall food containers, PLA straws, paper straws and U-shape straws for beverage and dairy applications. Its Dhulagarh facility in West Bengal covers 90,000 square feet, with stated monthly capacity of 665 metric tonnes for thin-wall containers, 160 metric tonnes for PLA straws and 95 metric tonnes for paper straws.
What expansion plans has GLEN disclosed after H1 FY27?
GLEN has disclosed a new manufacturing facility in Howrah and entry into paper and thermoforming products to expand capacity and product range. Chairman, Promoter and Director Lalit Agrawal said the initiatives form part of the company’s work toward long-term growth goals. The presentation does not state the facility’s investment cost, commissioning date, production capacity or expected revenue contribution.
The expansion plan follows a half-year revenue mix in which thin-wall containers accounted for 80.75%, compared with 19.25% combined for PLA and paper straws. This mix provides context for management’s stated plan to add paper and thermoforming products, but GLEN has not disclosed revenue targets for those product lines. Its existing container range spans 25 millilitres to 4,500 millilitres.
Management said product innovation, quality and sustainability position GLEN to capture opportunities as packaging demand shifts toward environmentally responsible products. This is management’s outlook rather than financial guidance: the presentation provides no FY27 target for revenue, EBITDA, PAT or margin. GLEN also reports more than 650 employees, operations across 26 states and presence in more than 80 cities, without prior-period comparisons for those measures.
Conclusion
GLEN’s H1 FY27 result shows that PAT increased faster than revenue because a Rs 2.5177 crore EBITDA increase was supplemented by a Rs 0.6534 crore reduction in interest and depreciation charges. Revenue added Rs 19.7403 crore year on year, while thin-wall containers remained the principal product category at 80.75% of revenue and exports accounted for 26.34%.
The next disclosed developments to watch are the Howrah manufacturing facility and GLEN’s entry into paper and thermoforming products. Management has said these initiatives will broaden capacity and range, but has not disclosed their timing, cost, capacity or financial targets. Future company updates may show whether the plans alter the 80.75% thin-wall container share or the 26.34% export share reported in H1 FY27.