










Grand Continent H1 FY27 EBITDA margin falls to 12.13% as income rises
Key highlights
- Grand Continent’s H1 FY27 total income rose 87% year on year to Rs 107.19 crore.
- Grand Continent’s EBITDA declined 17% sequentially to Rs 13.00 crore from Rs 15.60 crore.
- Grand Continent’s EBITDA margin was 12.13% in H1 FY27, versus 18.17% in H2 FY26.
- Grand Continent’s profit after tax fell 40% sequentially to Rs 6.02 crore.
powered by IRIS
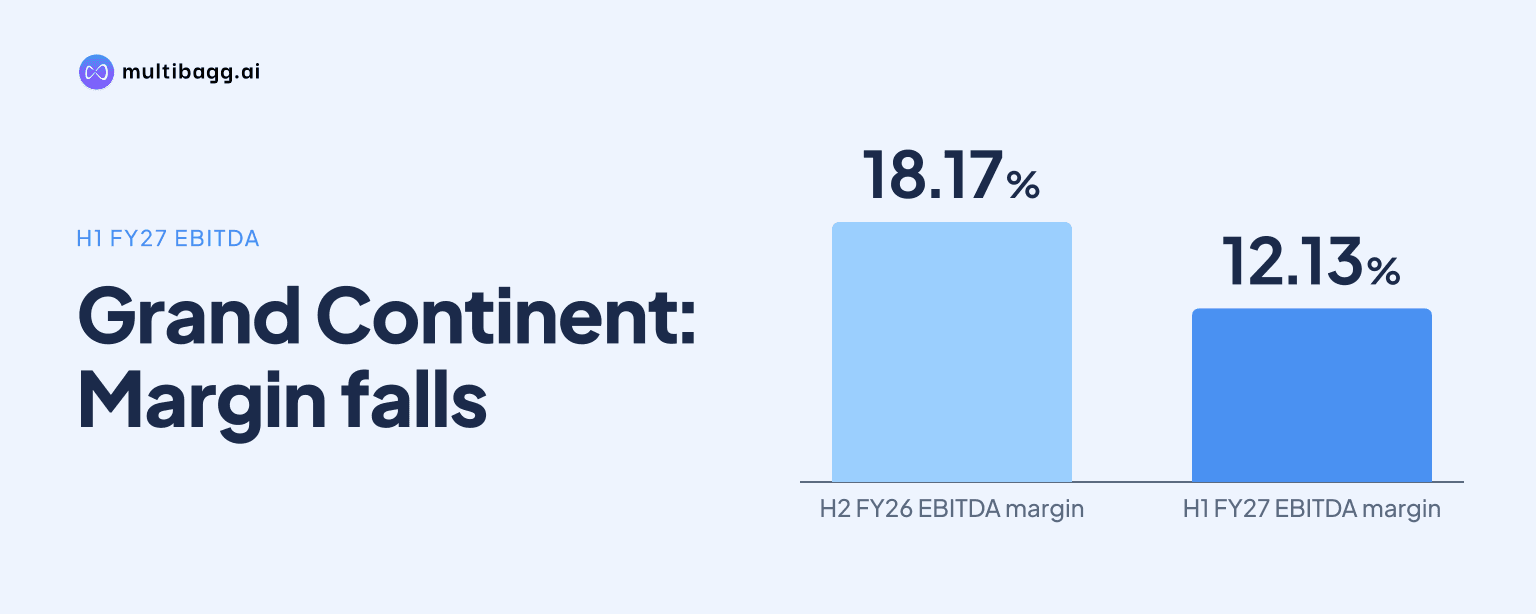
Grand Continent reported a 12.13% EBITDA margin in H1 FY27, down from 18.17% in H2 FY26, as total income rose 87% year on year to Rs 107.19 crore but EBITDA declined 17% sequentially to Rs 13.00 crore. Total expenditure increased to Rs 94.19 crore from Rs 70.22 crore in H2 FY26.
Know Grand Continent Hotels inside out
Results, valuation, peers and who's buying, in one view.
Why did Grand Continent’s H1 FY27 EBITDA margin decline?
Grand Continent’s EBITDA margin declined as expenditure increased by more than income in the H1 FY27 versus H2 FY26 comparison. Total income rose 25% to Rs 107.19 crore from Rs 85.82 crore, while total expenditure increased by Rs 23.97 crore to Rs 94.19 crore from Rs 70.22 crore. EBITDA consequently declined to Rs 13.00 crore from Rs 15.60 crore.
The EBITDA margin was 6.04 percentage points below the 18.17% reported in H2 FY26. The sequential movement differs from the year-on-year comparison: total income was Rs 57.19 crore, EBITDA was Rs 6.49 crore and EBITDA margin was 11.3% in H1 FY26. H1 FY27 therefore recorded a higher year-on-year margin but a lower sequential margin.
Which costs increased for Grand Continent in H1 FY27?
Grand Continent reported increases in both employee cost and other expenses in H1 FY27. Employee cost reached Rs 20.61 crore, against Rs 15.91 crore in H2 FY26 and Rs 11.29 crore in H1 FY26. Other expenses were Rs 73.58 crore, compared with Rs 54.31 crore sequentially and Rs 39.41 crore year on year.
Other expenses were the larger of the two reported expenditure lines, accounting for Rs 73.58 crore of the Rs 94.19 crore total expenditure in H1 FY27. Employee cost and other expenses together equal the reported total expenditure. The presentation does not provide a further line-item split of other expenses, so it does not identify the underlying operating-cost categories behind the increase.
How did Grand Continent’s profits change in H1 FY27?
Grand Continent’s profit after tax fell 40% sequentially to Rs 6.02 crore in H1 FY27 from Rs 10.10 crore in H2 FY26. Profit before tax declined 25% to Rs 8.04 crore from Rs 10.76 crore, while the profit after tax margin reduced to 5.62% from 11.76% and the profit before tax margin fell to 7.50% from 12.54%.
Depreciation increased to Rs 3.17 crore in H1 FY27 from Rs 2.94 crore in H2 FY26, while finance cost declined to Rs 1.79 crore from Rs 1.90 crore. Tax increased to Rs 1.96 crore from Rs 0.68 crore. Profit before minority interest was Rs 6.08 crore and minority interest was negative Rs 5 lakh, resulting in reported profit after tax of Rs 6.02 crore.
The year-on-year comparison was positive despite the sequential decline. Profit before tax increased from Rs 3.47 crore in H1 FY26 to Rs 8.04 crore in H1 FY27, while profit after tax rose from Rs 2.31 crore to Rs 6.02 crore. Basic earnings per share were Rs 2.42 in H1 FY27, compared with Rs 4.05 in H2 FY26 and Rs 0.93 in H1 FY26.
Got a follow-up? Ask IRIS
How does H1 FY27 compare with Grand Continent’s FY26 results?
Grand Continent’s H1 FY27 total income of Rs 107.19 crore was equivalent to about three-quarters of the Rs 143 crore reported for FY26, while H1 EBITDA of Rs 13.00 crore was below the FY26 figure of Rs 22 crore. The H1 FY27 EBITDA margin of 12.13% was also below FY26’s 15%.
FY26 profit before tax was Rs 14 crore, compared with Rs 13 crore in FY25, while profit after tax was Rs 12 crore against Rs 11 crore. However, FY26 profit before tax margin declined to 10% from 18.2% in FY25, and profit after tax margin fell to 9% from 14.7%. H1 FY27 margins of 7.50% before tax and 5.62% after tax were below the FY26 levels.
Grand Continent’s balance sheet total increased to Rs 216 crore in H1 FY27 from Rs 184 crore at March 2026. Property, plant and equipment rose to Rs 91 crore from Rs 84 crore, while capital work-in-progress increased to Rs 15 crore from Rs 5 crore. Long-term borrowings increased to Rs 38 crore from Rs 23 crore and the debt-to-equity ratio was 0.5, compared with 0.2 in FY26.
What operating data does Grand Continent report for its hotels?
Grand Continent reported India-wide occupancy of 67.7% and an average room rate of Rs 3,926. Its mature portfolio of 25 units and 1,280 keys recorded 69.0% occupancy and an average room rate of Rs 3,866. Two new units with 78 keys reported 41.6% occupancy and an average room rate of Rs 3,482.
The geographical data show Andhra Pradesh with the highest disclosed occupancy at 84.6% and an average room rate of Rs 4,013. Chennai had the highest listed average room rate at Rs 4,667 and occupancy of 66.4%, while Rajasthan reported 27.8% occupancy and a Rs 4,266 average room rate. The presentation does not provide prior-period comparisons for these India measures.
Grand Continent separately reported April-September 2026 United States property data against the corresponding 2025 period. Holiday Inn Missouri recorded average occupancy 3.9 percentage points higher and average room rate 10.2% higher. Ramada North Platte recorded occupancy 6.0 percentage points higher but average room rate 14.4% lower, while Comfort Inn Omaha reported occupancy 4.4 percentage points higher and average room rate 5.5% lower.
Conclusion
Grand Continent’s H1 FY27 income growth did not produce higher sequential earnings. Total income rose to Rs 107.19 crore from Rs 85.82 crore in H2 FY26, but total expenditure increased to Rs 94.19 crore from Rs 70.22 crore. EBITDA, profit before tax and profit after tax declined sequentially, and EBITDA margin reduced to 12.13% from 18.17%.
What to watch is whether Grand Continent provides a break-up of the Rs 73.58 crore in other expenses and how the Rs 15 crore of capital work-in-progress develops. The presentation also shows long-term borrowings of Rs 38 crore and a 0.5 debt-to-equity ratio in H1 FY27, compared with Rs 23 crore and 0.2 at FY26, respectively.