










Purple United Kids kept FY26 EBITDA margin at 20.9% in scale-up
Key highlights
- Purple United Kids reported a 20.9% EBITDA margin in FY26, compared with 21.9% in FY24.
- Purple United Kids’ revenue from operations increased to Rs 171 crore in FY26 from Rs 103 crore in FY25.
- Purple United Kids’ retail EBO share reached 40% of FY26 revenue, up from 20% in FY25.
- Purple United Kids reported 126 EBOs at 30 September 2026, including 99 high-street stores and 27 mall stores.
powered by IRIS
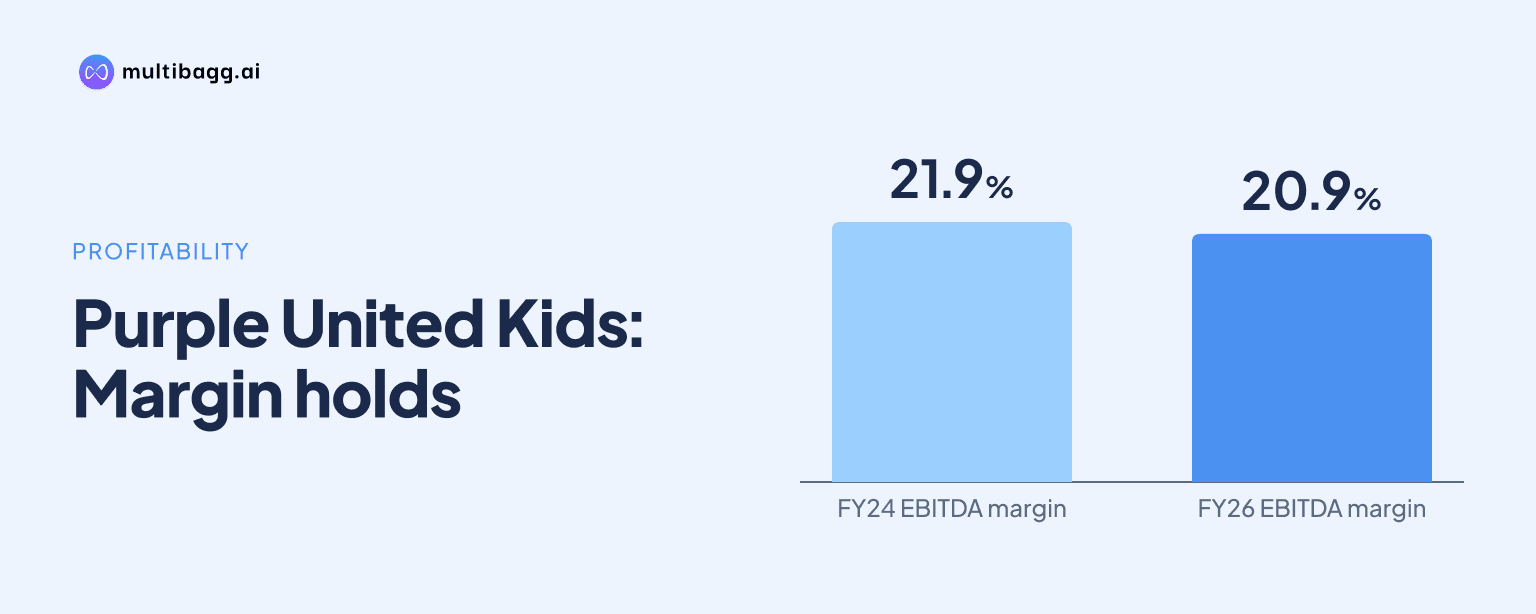
Purple United Kids reported a 20.9% earnings before interest, tax, depreciation and amortisation (EBITDA) margin in fiscal year (FY) 2026, keeping the measure above 20% while its exclusive brand outlet (EBO) count rose from 43 to 109. Revenue from operations reached Rs 171 crore in FY26, compared with Rs 103 crore in FY25.
Know Purple United Sales inside out
Results, valuation, peers and who's buying, in one view.
How did Purple United Kids’ profitability change through FY26?
Purple United Kids’ EBITDA margin was 20.9% in FY26, down 1.0 percentage point from 21.9% in FY24 but 0.8 percentage point above FY25’s 20.1%. The presentation describes the period as an investment-led scale-up phase and states that EBITDA margin held above 20% while the EBO network increased from 43 to 109. That comparison indicates that the reported operating margin remained above the 20% threshold despite a substantial expansion in the store base.
Gross margin rose to 59.7% in FY26 from 49.3% in FY25, although it remained below the 63.4% reported in FY24. Purple United Kids attributes the FY26 increase to its own-retail share reaching 40%. ROCE declined to 22.3% in FY26 from 26.9% in FY25, while ROE fell to 22.0% from 26.2%; both remained above their FY23 levels of 18.0% and 18.2%, respectively.
How fast did Purple United Kids’ revenue and store network grow?
Purple United Kids reported revenue from operations of Rs 171 crore in FY26, following Rs 103 crore in FY25 and Rs 26 crore in FY23. The FY27 roadmap slide labels this revenue trajectory as 158% compound annual growth rate and describes FY26 as showing about 75% year-on-year growth. The disclosed revenue figures show that scale-up extended beyond the earlier FY23 base, with FY26 revenue more than six times the FY23 amount.
The store rollout involved material per-location spending and working stock. Purple United Kids gives an investment of about Rs 70 lakh for each new store, including capital expenditure, security deposit and inventory, and says a typical store is about 1,550 square feet with average monthly rent of about Rs 1.7 lakh. It also says four to five months of sales are held as store inventory. By 30 September 2026, the company reported 126 EBOs, consisting of 99 high-street and 27 mall stores across 21 states and union territories.
Got a follow-up? Ask IRIS
How did Purple United Kids’ sales mix shift toward retail?
Purple United Kids’ retail EBO channel rose to 40% of revenue in FY26 from 20% in FY25, while distribution declined to 38% from 72%. The company links the higher own-retail share to the FY26 gross-margin increase. Key accounts also expanded to 20% of revenue in FY26 from 5% in FY25, showing that the reported mix change involved both company retail stores and larger partner accounts rather than distribution alone.
The mix remained tilted toward retail and key accounts in H1 FY27, when EBO retail represented 38% of revenue and key accounts 21%, against 35% for distribution and 5% for online sales. Apparel increased from 62% of revenue in FY25 to 66% in FY26 and 72% in H1 FY27. Footwear moved in the opposite direction, declining from 37% in FY25 to 33% in FY26 and 27% in H1 FY27, while accessories and hard goods remained at 1% in all three periods.
Purple United Kids also reported changes in sales by gender. Boys’ products contributed 51% of FY26 sales, up from 46% in FY25, while girls’ products decreased to 42% from 50%. Unisex and infants increased to 7% of FY26 sales from 4% in FY25, before returning to 4% in H1 FY27. These category and customer-mix figures provide context for the company’s stated emphasis on an omnichannel model that includes its website, marketplaces, key accounts and distributors alongside EBOs.
What does Purple United Kids disclose about debt and balance-sheet funding?
Purple United Kids does not disclose net debt, borrowings, current liabilities or total inventory balances in the supplied presentation pages, so a FY26 net-debt figure cannot be verified from this source. The disclosed financial data instead cover revenue, gross margin, EBITDA margin, ROCE and ROE for FY23 through FY26. The presentation therefore supports an assessment of operating scale and return ratios, but not a calculation of leverage or a conclusion about debt changes.
The source does disclose operating commitments relevant to the cash demands of store expansion: approximately Rs 70 lakh invested per new store, average monthly rent of about Rs 1.7 lakh and inventory equal to four to five months of sales at store level. Purple United Kids also states that factory outlets, at roughly one for every five EBOs, clear end-of-season stock. Those mechanisms describe how stock and store rollout are managed, but they do not establish aggregate inventory, payables or borrowings at FY26.
Conclusion
Purple United Kids combined a rise in revenue from Rs 26 crore in FY23 to Rs 171 crore in FY26 with a 20.9% FY26 EBITDA margin. The margin was below FY24’s 21.9% but above FY25’s 20.1%, while retail EBOs became 40% of FY26 revenue versus 20% in FY25 and distribution fell to 38% from 72%.
The next disclosed items to watch are the company’s FY27 growth levers of store expansion, omnichannel and digital activity, and operating leverage. Purple United Kids had 126 EBOs at 30 September 2026, but the FY27 revenue table provides no numerical FY27 estimate; the supplied pages also leave net debt, borrowing and aggregate working-capital balances unresolved.