










Purple United Kids triples retail revenue as distributor share falls
Key highlights
- Purple United Kids reported retail-channel revenue of Rs 68 crore in FY26, up from Rs 22 crore in FY25.
- Purple United Kids' distributor sales share declined to 38% in FY26 from 71% in FY25.
- Purple United Kids' own stores and key accounts accounted for 60% of FY26 sales, up from 26% in FY25.
- Purple United Kids expanded from 43 EBOs in FY25 to 109 in FY26 and 126 by 30 September 2026.
powered by IRIS
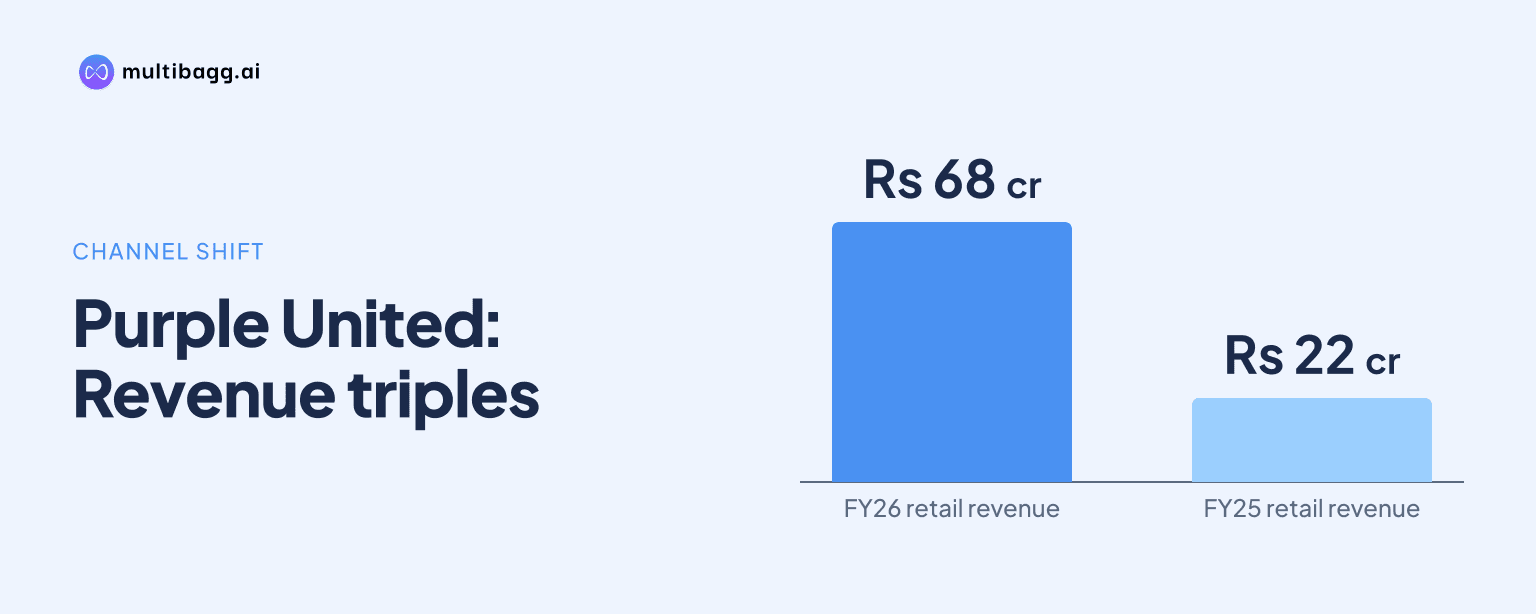
Purple United Kids tripled retail-channel revenue to Rs 68 crore in FY26 from Rs 22 crore in FY25, as distributor sales share fell to 38% from 71%. The shift followed 66 new Exclusive Brand Outlets, or EBOs, and lifted the combined share of own stores and key accounts to 60% from 26%.
Know Purple United Sales inside out
Results, valuation, peers and who's buying, in one view.
How did Purple United change its sales mix in FY26?
Purple United shifted its sales mix towards own stores and key accounts in FY26, whose combined share rose 34 percentage points to 60% from 26% in FY25. Distributor sales represented 38% of FY26 sales, down 33 percentage points from 71% in FY25, as the company described its model as moving from distribution-led sales towards its own brands and retail-led growth.
The change was accompanied by retail-channel revenue rising to Rs 68 crore in FY26 from Rs 22 crore in FY25. Total revenue increased to Rs 170.6 crore from Rs 103.1 crore over the same period, while the EBO network rose to 109 from 43. Purple United directly linked the roughly threefold increase in retail revenue to 66 new stores going live during FY26.
Purple United’s model keeps design, merchandising, quality control, warehousing and omnichannel selling in house, while partner factories handle sourcing and manufacturing. The company says it has zero owned manufacturing assets or plant capital expenditure, and operates a 30,000-square-foot centralised warehouse in Mundka, Delhi. That structure places store investment and brand building ahead of manufacturing assets.
What drove Purple United's retail revenue growth?
Purple United’s retail revenue growth was driven primarily by the increase in EBOs from 43 in FY25 to 109 in FY26. The FY26 network passed 100 stores for the first time, while total revenue increased by Rs 67.5 crore year on year to Rs 170.6 crore. The presentation specifically attributes the retail-channel increase to the 66-store rollout.
The FY26 expansion followed growth from 11 EBOs in FY23 to 109 in FY26, while revenue rose from Rs 25.7 crore to Rs 170.6 crore. Purple United reported an 88% revenue compound annual growth rate, or CAGR, for FY23 to FY26. Its first EBO opened in Delhi in FY20, and the network had reached seven stores by FY22 after expanding into Punjab.
Purple United also replaced its earlier business-to-business e-commerce customer connection with a direct-to-consumer, or D2C, site and customer relationship management capability. Its purpleunited.com website was rebuilt on Shopify, alongside marketplace distribution. The product range includes more than 650 active styles across apparel, footwear and accessories for boys, girls and infants aged 0 to 14 years.
The company identifies five owned brands: toothless, That’s his Style, That’s Hot Style, striders and BOLTZY. As of 30 September 2026, Purple United had 126 EBOs in 21 states and Union Territories, compared with the 109 reported for FY26. The higher September count included continued expansion after the financial year-end.
Got a follow-up? Ask IRIS
How did the store rollout affect Purple United's margins and returns?
Purple United reported a 59.7% gross margin and a 20.9% earnings before interest, tax, depreciation and amortisation, or EBITDA, margin in FY26 while its EBO count rose from 43 to 109. Gross margin increased 10.4 percentage points from 49.3% in FY25, which management attributed to own-retail share reaching 40%. EBITDA margin increased 0.8 percentage points from 20.1%.
The FY26 gross margin recovered from FY25 but remained below the 63.4% reported in FY24. Return on capital employed, or ROCE, declined to 22.3% in FY26 from 26.9% in FY25, while return on equity, or ROE, declined to 22.0% from 26.2%. The figures show higher gross and EBITDA margins year on year alongside lower return ratios during the store rollout.
Purple United estimates investment of about Rs 70 lakh per new store, including capital expenditure, security deposit and inventory. Its average store is about 1,550 square feet, with average monthly rent of about Rs 1.7 lakh and inventory equal to four to five months of sales. Management estimates a store EBITDA margin of about 20% in year one and about 22% from year three.
Where does Purple United sell after the channel shift?
Purple United sells through owned retail, its own website, third-party marketplaces, key accounts and distributors. At 30 September 2026, its 126 EBOs comprised 99 high-street stores and 27 mall stores across 21 states and Union Territories. It also operates factory outlets at a stated ratio of one for every five EBOs to clear end-of-season inventory.
Purple United’s marketplace partners include Myntra, Ajio, Amazon, Flipkart, FirstCry and Nykaa, where the company says it maintains a never-out-of-stock core range. Its offline key accounts include shop-in-shops and large-format stores such as Reliance and V-Retail. Distributors remain part of the network through multi-brand outlets, despite their sales share declining to 38% in FY26.
As of 30 September 2026, Purple United reported 1.96 lakh square feet of retail area, a blended all-channel average selling price of Rs 814 and a 26% customer repeat rate. Same-store sales growth for stores with at least 18 months of vintage was 20%. Weekly sell-through reviews, size-wise refills and inter-store transfers support inventory replenishment across the retail network.
Conclusion
Purple United’s FY26 performance shows a material change in its route to market: retail-channel revenue reached Rs 68 crore, own stores and key accounts accounted for 60% of sales, and distributor share declined to 38%. The company expanded its EBO network from 43 to 109 during the year, while total revenue rose to Rs 170.6 crore and EBITDA margin reached 20.9%.
The next disclosed point to watch is the store rollout after the network reached 126 EBOs on 30 September 2026. Management’s FY27 roadmap identifies store expansion, omnichannel and digital development, and operating leverage as growth levers, while the presentation displays an approximately 75% year-on-year growth objective without providing a numerical FY27 revenue figure.