










Purple United H1 FY27 revenue more than doubles, margins fall
Key highlights
- Purple United reported H1 FY27 revenue of Rs 123.7 crore, up 103.6% year on year.
- Purple United's EBITDA margin declined to 19.2% in H1 FY27 from 20.7% in H1 FY26.
- Purple United's finance cost rose 150.6% year on year to Rs 9.6 crore in H1 FY27.
- Purple United's short-term borrowings increased to Rs 138.2 crore at 30 September 2026 from Rs 83.9 crore at 31 March 2026.
powered by IRIS
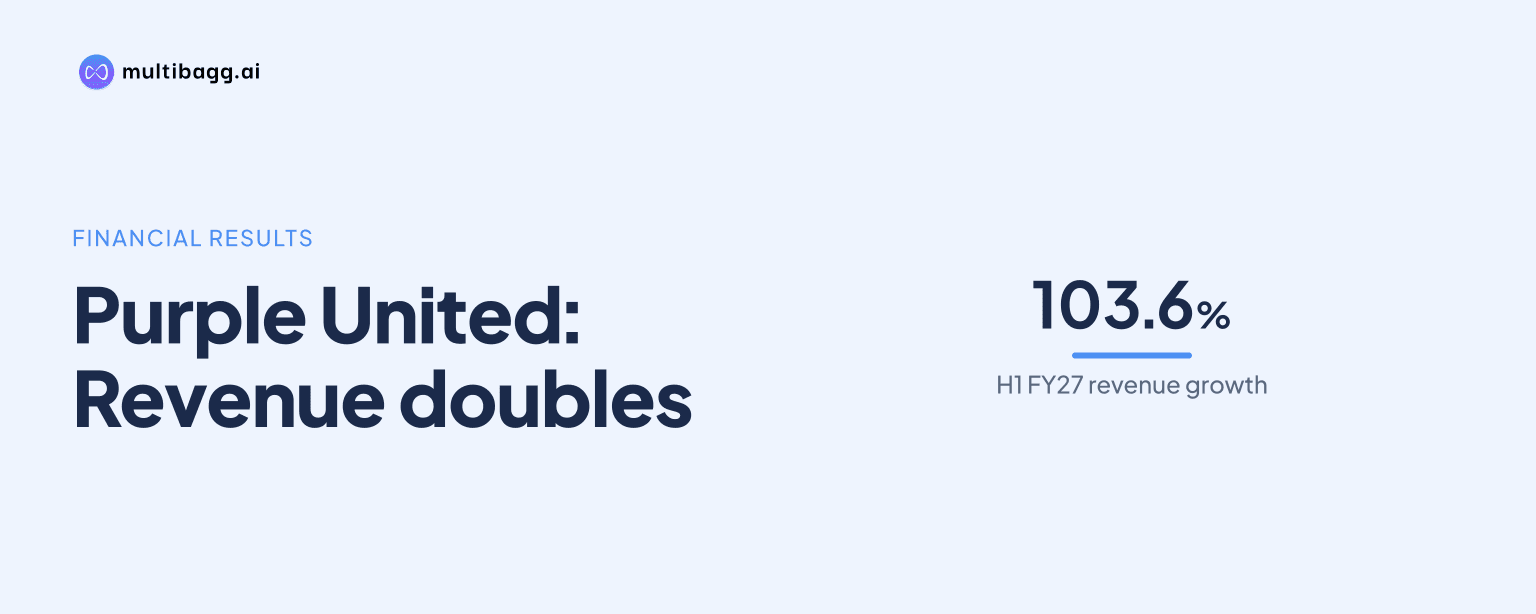
Purple United Kids reported H1 FY27 revenue from operations of Rs 123.7 crore, up 103.6% year on year, but its profit after tax margin fell to 6.5% from 8.3% as expenses increased 107.6% and finance cost rose 150.6% to Rs 9.6 crore.
Know Purple United Sales inside out
Results, valuation, peers and who's buying, in one view.
How fast did Purple United grow in H1 FY27?
Purple United more than doubled revenue in H1 FY27, with revenue from operations increasing from Rs 60.7 crore in H1 FY26 to Rs 123.7 crore. Revenue was also 12.5% above Rs 109.9 crore in H2 FY26, showing growth against both the year-earlier half and the immediately preceding half.
Expenses increased 107.6% year on year to Rs 99.9 crore in H1 FY27, slightly faster than the 103.6% increase in revenue. Against H2 FY26, expenses rose 15.1% from Rs 86.8 crore, compared with a 12.5% increase in revenue. These comparisons coincided with lower operating margins in H1 FY27.
Earnings before interest, tax, depreciation and amortisation, or EBITDA, rose 88.6% year on year to Rs 23.7 crore. However, EBITDA was only 2.8% higher than Rs 23.1 crore in H2 FY26, while revenue grew 12.5% sequentially. Profit before tax and profit after tax were both below their H2 FY26 levels despite being higher than H1 FY26.
Why did Purple United's margins decline despite sales growth?
Purple United's presentation does not specify a cause for the margin movement, but it shows that expenses rose faster than revenue in H1 FY27. EBITDA margin declined to 19.2% from 20.7% in H1 FY26, a decline of 153 basis points, and from 21.0% in H2 FY26, a decline of 182 basis points.
Below EBITDA, finance cost rose 150.6% year on year to Rs 9.6 crore from Rs 3.8 crore in H1 FY26. It was also 64.1% above Rs 5.9 crore in H2 FY26. Depreciation increased 67.2% year on year to Rs 4.2 crore, while other income increased to Rs 0.9 crore from Rs 0.3 crore.
Profit before tax increased 66.3% year on year to Rs 10.8 crore but declined 22.4% from Rs 13.9 crore in H2 FY26. Its margin fell to 8.8% from 10.7% a year earlier and 12.7% in the preceding half. Profit after tax rose 60.1% year on year to Rs 8.1 crore, while its margin declined 178 basis points year on year to 6.5% and 269 basis points from the 9.2% reported in H2 FY26.
Got a follow-up? Ask IRIS
What changed in Purple United's balance sheet by September 2026?
Purple United's total equity rose to Rs 83.8 crore at 30 September 2026 from Rs 75.7 crore at 31 March 2026, while total equity and liabilities increased to Rs 303.3 crore from Rs 232.0 crore. Reserves and surplus rose to Rs 74.2 crore from Rs 66.1 crore, and share application money pending allotment was Rs 1.6 crore at the September reporting date.
Short-term borrowings increased to Rs 138.2 crore at 30 September 2026 from Rs 83.9 crore at 31 March 2026. Long-term borrowings moved in the other direction, declining to Rs 12.1 crore from Rs 12.9 crore. Total current liabilities increased to Rs 189.7 crore from Rs 129.7 crore, while total non-current liabilities rose to Rs 28.2 crore from Rs 26.5 crore.
On the asset side, inventories increased to Rs 82.7 crore from Rs 73.1 crore and trade receivables rose to Rs 68.0 crore from Rs 59.6 crore. Cash and bank balances increased to Rs 24.9 crore from Rs 12.7 crore. Other current assets rose to Rs 78.1 crore from Rs 40.1 crore, lifting total current assets to Rs 253.7 crore from Rs 185.8 crore.
What is Purple United planning after H1 FY27?
Purple United's management says it is pursuing cluster-led retail expansion, stronger digital channels and improved store productivity. Management also says the business has moved from a distribution-led model to an integrated retail- and e-commerce-led brand platform with five owned brands, and expects newer-store maturity and rising brand awareness to support operating leverage.
The company's retail technology presentation describes a data loop linking its Shopify direct-to-consumer storefront, customer relationship management and loyalty systems, and replenishment decisions. It reports about 3 lakh customers currently and identifies 1 million as a target. Weekly sell-through reviews, size-wise refills and inter-store transfers are the mechanisms cited for matching stock to demand.
Historical figures provide context for the expansion plan. Revenue rose from Rs 43.0 crore in FY24 to Rs 103.0 crore in FY25 and Rs 171.0 crore in FY26. EBITDA margin was 21.9% in FY24, 20.1% in FY25 and 20.9% in FY26, while profit after tax margin moved from 9.8% to 10.2% and then 8.9% across those three years.
Conclusion
Purple United delivered a Rs 63.0 crore year-on-year increase in H1 FY27 revenue, but profit did not rise at the same pace. Expenses grew 107.6%, finance cost reached Rs 9.6 crore, and EBITDA, profit before tax and profit after tax margins all declined. Profit after tax increased by Rs 3.0 crore year on year, but its 60.1% growth rate trailed the 103.6% increase in revenue.
The next reported periods will indicate whether management's cluster-led retail expansion, digital-channel initiatives and store-productivity plans produce the operating leverage it expects. Disclosed measures to watch include EBITDA margin after its fall to 19.2%, finance cost after its rise from Rs 3.8 crore to Rs 9.6 crore year on year, and short-term borrowings, which stood at Rs 138.2 crore at 30 September 2026.