










India Shelter’s CRAR fell to 53.5% as leverage rose
Key highlights
- India Shelter’s CRAR was 53.5% in Q2FY27, down from 59.1% in Q1FY27.
- India Shelter’s reported leverage rose to 3.1 times in Q2FY27 from 3.0 times in Q1FY27.
- India Shelter had Rs 6,849 crore of borrowings and Rs 9,270.6 crore of loan assets at September 2026.
- India Shelter reported Q2FY27 profit after tax of Rs 145.6 crore and return on equity of 17.3%.
powered by IRIS
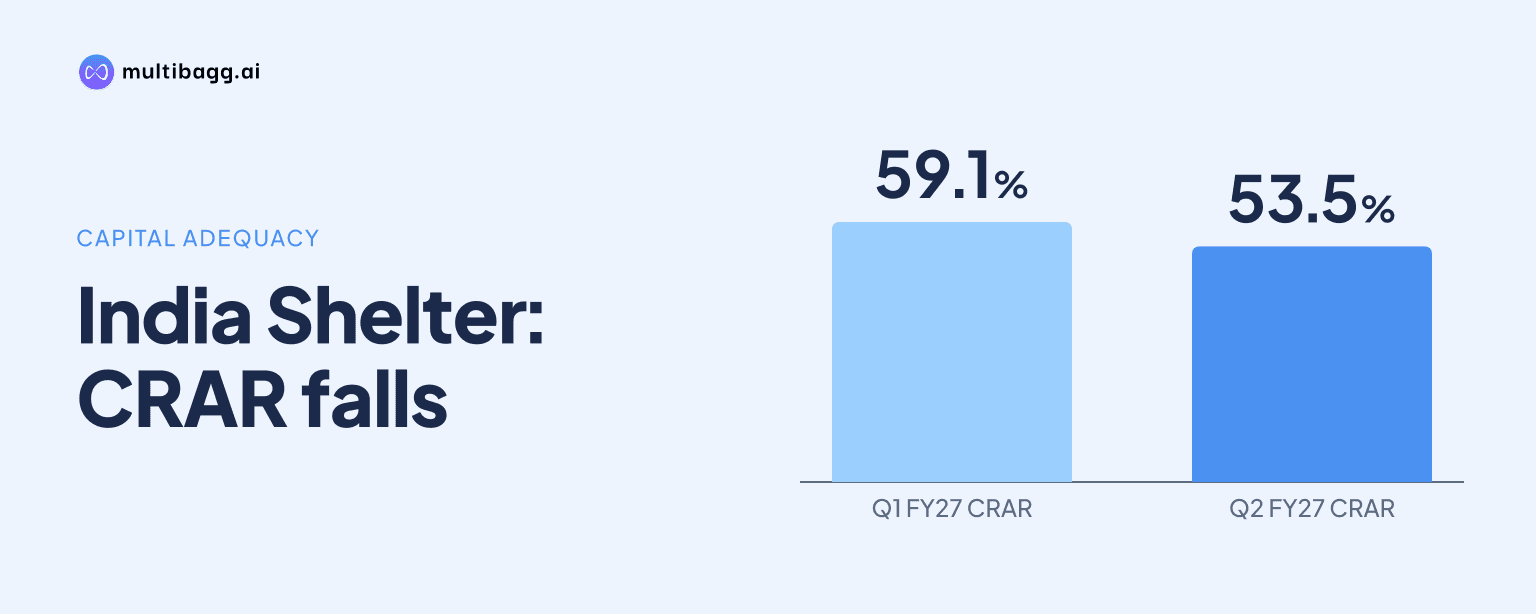
India Shelter Finance Corporation Limited reported a capital to risk-weighted assets ratio, or CRAR, of 53.5% in Q2FY27, down from 59.1% in Q1FY27, while reported leverage increased to 3.1 times from 3.0 times. At September 2026, borrowings stood at Rs 6,849 crore and loan assets at Rs 9,270.6 crore.
Know India Shelter Finance Corporation inside out
Results, valuation, peers and who's buying, in one view.
Why did India Shelter’s CRAR fall in Q2FY27?
India Shelter’s CRAR fell by 5.6 percentage points sequentially to 53.5% in Q2FY27 from 59.1% in Q1FY27. The Q2FY27 ratio was also below 57.1% in Q2FY26 and 56.4% in FY26. India Shelter reported the same 53.5% CRAR for H1FY27, which reflects the September 2026 position.
The presentation does not specify the cause of the quarter-on-quarter change in CRAR. It does show that the company’s reported leverage rose to 3.1 times in Q2FY27 from 3.0 times in Q1FY27 and FY26, and from 2.9 times in Q2FY26. Total sources of funds increased to Rs 10,435.5 crore at September 2026 from Rs 9,615 crore at March 2026.
India Shelter also presents a separate leverage calculation in its return-on-equity tree, defining it as average total assets divided by average net worth. This measure was 3.0 times in Q2FY27, compared with 2.9 times in Q2FY26 and 3.0 times in Q1FY27. The different Q2FY27 figures arise from the two reported ratio presentations rather than from an explanation of their difference in the presentation.
How did India Shelter fund balance-sheet growth at September 2026?
India Shelter funded balance-sheet growth through higher borrowings and reserves at September 2026. Borrowings reached Rs 6,849 crore, up Rs 603 crore from Rs 6,246 crore at March 2026 and up Rs 1,356.8 crore from Rs 5,492.2 crore at September 2025. Reserves and surplus increased to Rs 3,346.3 crore from Rs 3,143.7 crore six months earlier.
Share capital was Rs 54.6 crore at September 2026, compared with Rs 54.4 crore at March 2026. Other liabilities and provisions were Rs 185.6 crore, up from Rs 170.8 crore at March 2026. The presentation notes that figures through FY26 are on a consolidated basis, which qualifies comparisons with the March 2026 data.
Loan assets grew by Rs 702.1 crore over the six months to September 2026, reaching Rs 9,270.6 crore from Rs 8,568.5 crore. Investments rose to Rs 629.7 crore from Rs 395.2 crore, while cash and bank balances declined to Rs 180.1 crore from Rs 304.9 crore. Book value per share rose to 311.4 in Q2FY27 from 308.0 in Q1FY27 and 294.1 in FY26.
Got a follow-up? Ask IRIS
What happened to India Shelter’s profits and return ratios?
India Shelter reported profit after tax of Rs 145.6 crore in Q2FY27, up from Rs 143 crore in Q1FY27 and Rs 122 crore in Q2FY26. Total income was Rs 450.5 crore, 4% higher quarter on quarter and 22% higher year on year. Finance cost increased 6% sequentially to Rs 128.2 crore from Rs 120.9 crore.
Return on assets, defined by India Shelter as profit after tax to average total assets, was 5.7% in Q2FY27. This was below 5.8% in both Q1FY27 and Q2FY26. Return on equity, defined as profit after tax to average net worth, was 17.3%, compared with 17.5% in Q1FY27 but 17.0% in Q2FY26.
Net interest margin to average total assets was 12.6% in Q2FY27, compared with 12.7% in Q1FY27 and 12.4% in Q2FY26. Net interest income to average total assets was 9.5%, up from 9.1% a year earlier but down from 9.7% in the preceding quarter. Operating expenses to average total assets were 4.6%, unchanged sequentially and above 4.4% a year earlier.
What asset-quality measures accompanied the higher leverage?
India Shelter reported gross Stage 3 loans of Rs 147.1 crore at September 2026, equal to 1.5% of the portfolio. The Stage 3 proportion was unchanged from June 2026 but higher than 1.2% at September 2025 and March 2026. Expected credit loss, or ECL, provisions against Stage 3 loans were Rs 37.5 crore, resulting in a 25% Stage 3 provision coverage ratio.
Gross Stage 2 loans were Rs 371.9 crore, or 3.9% of the portfolio, compared with 4.1% at June 2026 and 3.8% at September 2025. Total ECL provisions were Rs 97.4 crore, equal to 1.0% of the portfolio, versus Rs 93.2 crore in June 2026 and Rs 72.8 crore a year earlier. Gross Stage 1, Stage 2 and Stage 3 loans together totalled Rs 9,511.6 crore.
Credit cost to average total assets increased to 0.6% in Q2FY27 from 0.5% in Q1FY27 and Q2FY26. Quarterly credit cost was Rs 16.3 crore, compared with Rs 13.4 crore in Q1FY27 and Rs 9.5 crore in Q2FY26. The presentation does not quantify a direct relationship between these credit measures and the CRAR movement.
Conclusion
India Shelter’s September 2026 disclosures show balance-sheet expansion funded by higher borrowings and a rise in reserves, alongside a decline in CRAR to 53.5% and reported leverage of 3.1 times. Loan assets increased to Rs 9,270.6 crore, while Q2FY27 profit after tax rose to Rs 145.6 crore and return on equity was 17.3%.
The next disclosures to watch are management’s stated plans to diversify borrowings, enhance its credit rating, prioritise long-term borrowings and scale co-lending opportunities. India Shelter also plans to deepen branch penetration in adjacent markets and increase its concentration in Tier II and Tier III cities, which may affect loan growth, funding mix and reported leverage.