










Indo-MIM H1 FY27 PAT rises 57% as EBITDA margin expands
Key highlights
- Indo-MIM reported H1 FY27 consolidated PAT of Rs 455.31 crore, up 57.0% year on year.
- Indo-MIM’s H1 FY27 consolidated EBITDA margin rose 630 basis points to 32.0%.
- Indo-MIM’s revenue from operations increased 11.8% to Rs 2,490.58 crore in H1 FY27.
- Indo-MIM’s standalone PAT rose 51.7% to Rs 443.50 crore in H1 FY27.
powered by IRIS
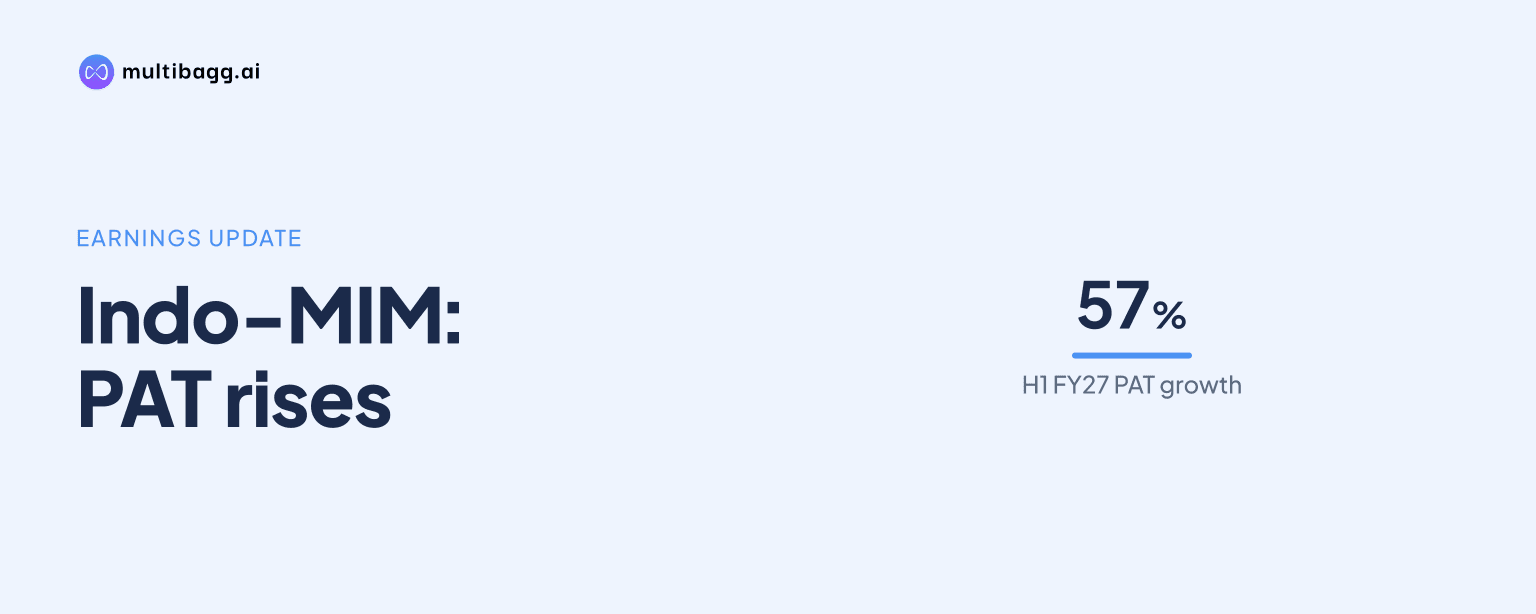
Indo-MIM Limited reported H1 FY27 consolidated profit after tax (PAT) of Rs 455.31 crore, up 57.0% year on year for the half year ended 30 September 2026, while revenue rose 11.8% to Rs 2,490.58 crore and EBITDA margin expanded to 32.0% from 25.7%.
Know Indo-MIM inside out
Results, valuation, peers and who's buying, in one view.
What drove Indo-MIM’s H1 FY27 profit increase?
Indo-MIM’s PAT increase followed operating profit growth that exceeded its revenue growth in H1 FY27. Revenue from operations increased by Rs 263.83 crore from Rs 2,226.75 crore in H1 FY26, while earnings before interest, tax, depreciation and amortisation (EBITDA) increased by Rs 220.99 crore to Rs 803.41 crore.
Revenue grew 11.8% year on year, compared with EBITDA growth of 37.9% and PAT growth of 57.0%. Indo-MIM described the difference between sales and EBITDA growth as improved operating leverage and cost efficiency, while management cited “healthy business momentum and strong execution” in its H1 FY27 investor takeaway.
The executive summary also reported that PAT rose 100.0% quarter on quarter, although it did not disclose the prior-quarter PAT amount or revenue comparison. Over the six-month period, basic earnings per share (EPS) increased 55.2% to Rs 9.34, and diluted EPS rose 55.9% to Rs 9.18.
How did Indo-MIM’s consolidated margins change in H1 FY27?
Indo-MIM’s consolidated EBITDA margin rose to 32.0% in H1 FY27 from 25.7% in H1 FY26, an increase of about 630 basis points, with 100 basis points equal to one percentage point. Net margin increased to 18.2% from 12.8%, a rise of about 540 basis points, alongside EBITDA growth to Rs 803.41 crore.
Profit before exceptional items and tax rose 30.2% to Rs 634.78 crore, which was faster than revenue growth but slower than the 57.0% rise in PAT. The presentation does not provide a numerical reconciliation between profit before exceptional items and tax and PAT, so it does not specify the factors behind the difference in those growth rates.
EPS broadly tracked the bottom-line increase in the six months ended 30 September 2026. Basic EPS rose from Rs 6.02 to Rs 9.34 and diluted EPS rose from Rs 5.88 to Rs 9.18; the H1 FY27 difference between the two measures was Rs 0.16.
Got a follow-up? Ask IRIS
How did Indo-MIM standalone results compare with consolidated results?
Indo-MIM’s standalone revenue rose 7.5% to Rs 2,073.10 crore in H1 FY27 from Rs 1,927.70 crore in H1 FY26, below the consolidated growth rate of 11.8%. Standalone EBITDA increased 15.7% to Rs 741.60 crore, and standalone EBITDA margin increased to 35.5% from 32.7%.
Standalone PAT grew 51.7% to Rs 443.50 crore from Rs 292.38 crore, while standalone net margin rose to 21.2% from 14.9%. Consolidated PAT of Rs 455.31 crore was Rs 11.81 crore above standalone PAT, and both reporting views showed profit growth exceeding their respective revenue growth rates.
The consolidated-to-standalone revenue gap widened to about Rs 417.50 crore in H1 FY27 from about Rs 299.10 crore in H1 FY26. The presentation lists Indo-MIM Inc. USA, Triax Industries and Conway Marsh Garrett Technologies as subsidiaries in both periods, with Phoenix Deventures and Indo-MIM Arms Components included in the H1 FY27 list.
The presentation does not quantify the revenue, earnings or margin contribution of any individual subsidiary. It therefore establishes that the consolidated revenue gap increased by about Rs 118.40 crore, but does not attribute that change between the subsidiaries already listed in H1 FY26 and the two listed in H1 FY27.
What is management’s margin outlook for Indo-MIM?
Indo-MIM reported a profit before exceptional items and tax (PBEIT) margin of 25.3% in H1 FY27, compared with 21.5% in H1 FY26 and 20.7% in H1 FY25. The presentation displays a 20% to 25% management normal-course EBITDA margin framework beside the PBEIT margin history, with a 22.5% midpoint.
Management attributed the elevated H1 margin outcome to a higher contribution from defence and medical activity, including tooling income. The presentation says margins can have upside in years when defence or medical revenue represents a higher mix, but does not disclose the H1 FY27 revenue or profit contribution from those activities.
PAT margin was 18.2% in H1 FY27, versus 12.8% in H1 FY26 and 15.9% in H1 FY25. Management presents a normalised PAT margin range of 13% to 18%, with a 15.6% midpoint, meaning the reported H1 FY27 margin was 0.2 percentage points above the stated upper end.
The margin ranges are management frameworks rather than a forecast for a specific future period. The source identifies product mix and tooling income as reasons for the H1 FY27 result, but does not set a defence, medical or tooling revenue target that would allow readers to calculate a future margin outcome.
Conclusion
Indo-MIM’s H1 FY27 results showed revenue growth of 11.8% alongside EBITDA growth of 37.9% and PAT growth of 57.0%. The 630-basis-point increase in consolidated EBITDA margin and the 540-basis-point rise in net margin accompanied that widening gap, while the standalone results also recorded profit growth ahead of revenue growth.
The next result to watch is whether the defence and medical mix, including tooling income, remains elevated enough to sustain margins near H1 FY27 levels. Management has disclosed normal-course ranges of 20% to 25% for EBITDA margin and 13% to 18% for PAT margin, but has not disclosed segment-level revenue amounts or a future mix target.