










Indo-MIM Limited H1 FY27 margins exceeded stated ranges
Key highlights
- Indo-MIM reported a 25.3% PBEIT margin in H1 FY27, compared with 21.5% in H1 FY26.
- Indo-MIM’s consolidated PAT rose 57.0% to Rs 455.31 crore on 11.8% revenue growth to Rs 2,490.58 crore.
- Indo-MIM reported an 18.2% H1 FY27 PAT margin, above the stated 13–18% range.
- Indo-MIM’s operating cash flow was 55.3% of EBITDA in H1 FY27, compared with 97.4% in H1 FY26.
powered by IRIS
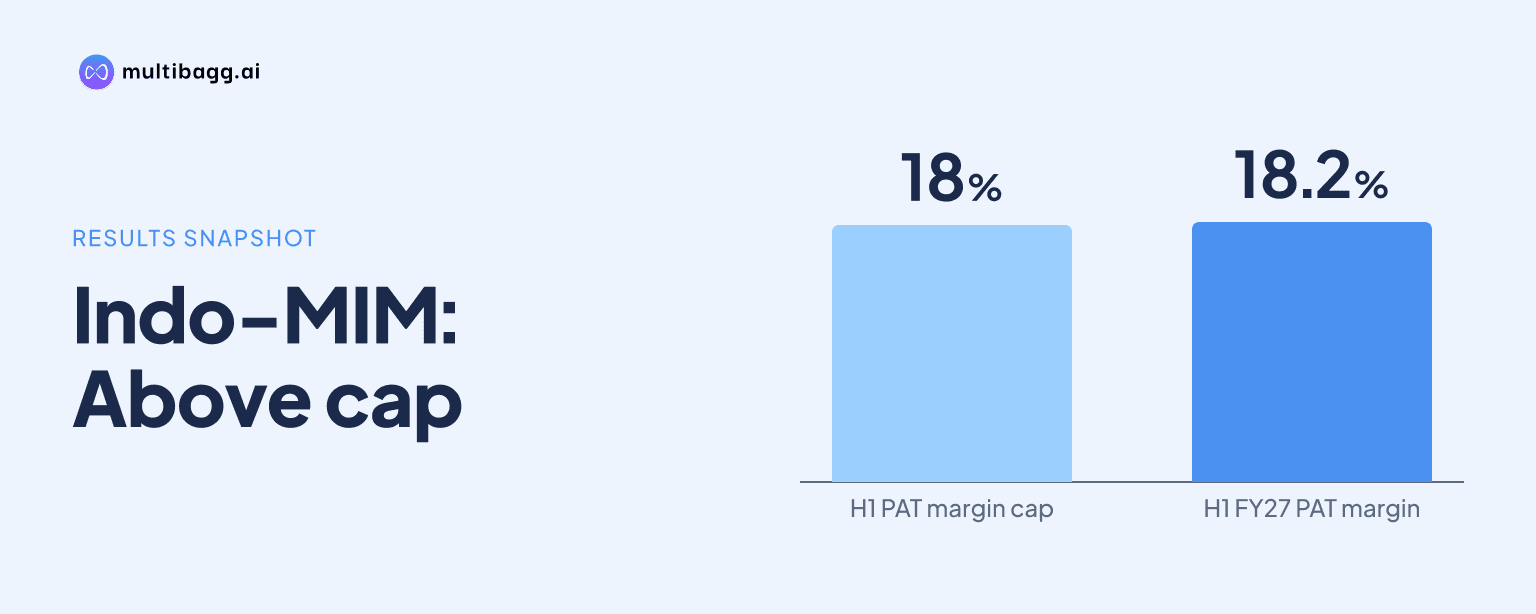
Indo-MIM Limited’s H1 FY27 PBEIT margin was 25.3%, above management’s stated 20–25% normal-course range, and PAT margin was 18.2%, above its 13–18% range. Management attributed the elevated half-year outcome to higher defence and medical contribution, including tooling income, while consolidated PAT rose 57.0% to Rs 455.31 crore.
Know Indo-MIM inside out
Results, valuation, peers and who's buying, in one view.
Why were Indo-MIM’s H1 FY27 margins elevated?
Indo-MIM said higher defence and medical contribution, including tooling income, elevated its H1 FY27 margin outcome. The presentation also says this mix “lifted margin to about 16%”, but does not identify the margin measure represented by that figure or quantify the separate contribution from defence, medical business or tooling income.
PBEIT, or profit before exceptional items and tax, margin was 25.3% in H1 FY27, compared with 21.5% in H1 FY26 and 20.7% in H1 FY25. The H1 FY27 result was 3.8 percentage points above the prior-year half and 4.6 percentage points above H1 FY25, showing that the reported uplift was larger than the movement in the preceding two half-year periods.
The 25.3% PBEIT margin was 2.8 percentage points above the 22.5% midpoint of the 20–25% framework. Indo-MIM identifies years with a higher defence or medical revenue mix as the source of upside, rather than disclosing a separate margin target for either segment.
How did Indo-MIM’s H1 FY27 profit compare with H1 FY26?
Indo-MIM’s consolidated PAT margin rose to 18.2% in H1 FY27 from 12.8% in H1 FY26, an increase of about 540 basis points. PAT rose 57.0% to Rs 455.31 crore from Rs 290.03 crore, while revenue from operations increased 11.8% to Rs 2,490.58 crore from Rs 2,226.75 crore.
Earnings before interest, tax, depreciation and amortisation, or EBITDA, increased 37.9% to Rs 803.41 crore in H1 FY27 from Rs 582.42 crore a year earlier. EBITDA margin rose to 32.0% from 25.7%, or about 630 basis points, while profit before exceptional items and tax increased 30.2% to Rs 634.78 crore from Rs 487.41 crore.
The standalone business recorded lower revenue growth than the consolidated business but higher reported operating and net margins in H1 FY27. Standalone revenue rose 7.5% to Rs 2,073.1 crore, EBITDA increased 15.7% to Rs 741.6 crore, and EBITDA margin rose to 35.5% from 32.7%; standalone PAT increased 51.7% to Rs 443.5 crore.
Got a follow-up? Ask IRIS
What margin ranges has Indo-MIM management stated?
Indo-MIM presents a 20–25% normal-course range beside its PBEIT-margin table and a 13–18% range beside its PAT-margin table. The respective midpoints are 22.5% and 15.6%, compared with H1 FY27 reported margins of 25.3% for PBEIT and 18.2% for PAT.
The labels in the presentation require distinction between the reported measures and management’s wording. Page 7 places the 20–25% range beneath a PBEIT heading but calls it a “normal-course EBITDA margin framework”, while Page 8 describes the 13–18% PAT range using the same EBITDA-framework wording. Indo-MIM does not provide a reconciliation on the outlook pages that makes the 20–25% PBEIT presentation interchangeable with the reported 32.0% EBITDA margin.
PAT margin was 18.2% in H1 FY27, compared with 15.9% in H1 FY25 and 12.8% in H1 FY26. It was 0.2 percentage points above the upper end of the disclosed 13–18% band, while management’s stated source of upside remained a higher mix of defence or medical revenue.
What other H1 FY27 indicators changed for Indo-MIM?
Indo-MIM reported higher return measures and lower leverage as of 30 September 2026. Return on capital employed was 36.5%, compared with 30.8% in H1 FY26, while return on equity, also called return on net worth, was 26.3% versus 22.9%.
Debt-to-equity declined to 0.27 times in H1 FY27 from 0.50 times in H1 FY26, and net debt to EBITDA declined to 0.19 times from 0.75 times. These changes accompanied consolidated PAT of Rs 455.31 crore and an EBITDA margin of 32.0% in the six-month period.
Working capital as a share of revenue rose to 33.7% from 25.6%, while operating cash flow as a share of EBITDA declined to 55.3% from 97.4%. The presentation provides no stated cause for either movement, but the figures show that the higher H1 FY27 profit coincided with a larger working-capital ratio and a lower operating-cash-flow-to-EBITDA ratio than in H1 FY26.
Conclusion
Indo-MIM’s H1 FY27 outcome placed both disclosed profitability measures above their stated normal-course bands, with PBEIT margin at 25.3% and PAT margin at 18.2%. Consolidated revenue rose 11.8% to Rs 2,490.58 crore, but EBITDA and PAT rose faster, by 37.9% and 57.0% respectively, alongside the higher defence, medical and tooling contribution cited by management.
The next reported periods will show whether defence and medical mix, including tooling income, remains elevated, because management identifies that mechanism as the source of margin upside. Readers can also watch working capital, which was 33.7% of revenue at 30 September 2026, and operating cash flow, which was 55.3% of EBITDA, for evidence of whether cash conversion changes after H1 FY27.