










KRYSTAL lowers West revenue share as South reaches 22.7%
Key highlights
- KRYSTAL’s West geographic revenue share fell to 66.9% in FY26 from 79.0% in FY25.
- KRYSTAL’s South contribution rose 10.2 percentage points to 22.7% in FY26.
- North and Central together represented 10.5% of KRYSTAL’s FY26 mix, up from 8.5% in FY25.
- KRYSTAL reported FY26 revenue from operations of Rs 1,277.275 crore, versus Rs 1,212.784 crore in FY25.
powered by IRIS
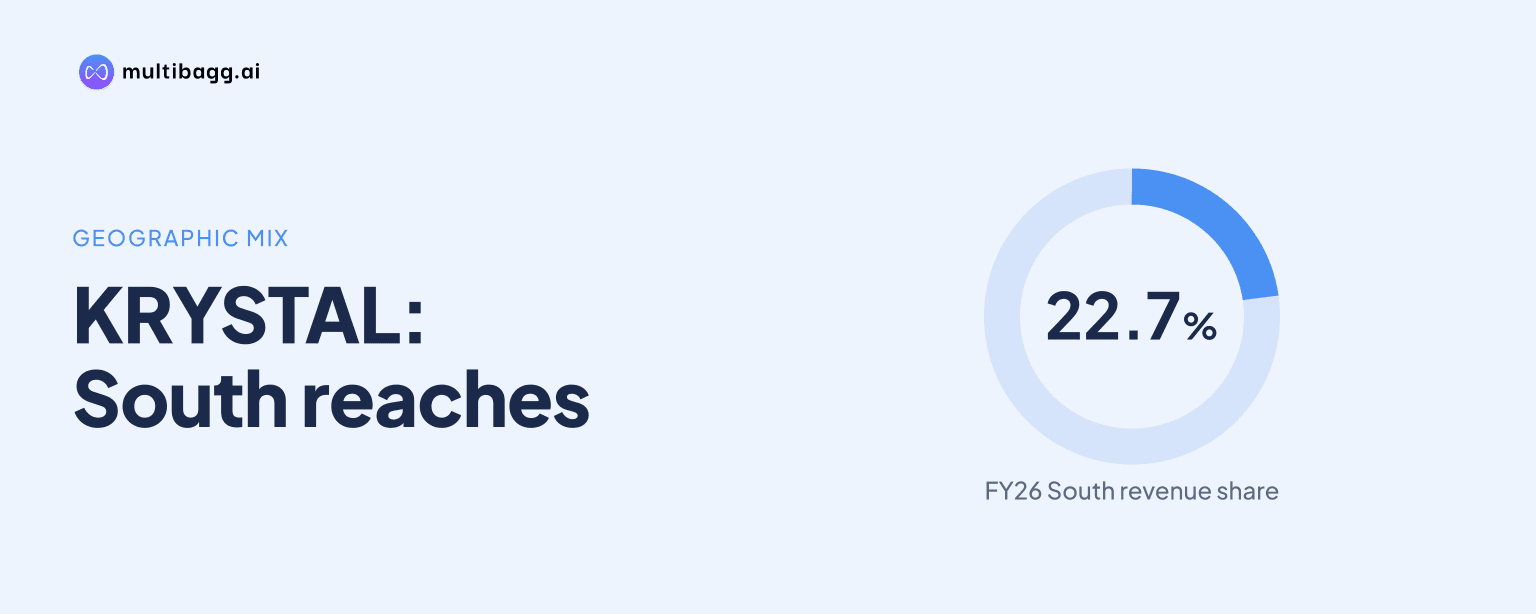
KRYSTAL reduced the West’s share of its geographic revenue mix to 66.9% in FY26 from 79.0% in FY25, while the South’s contribution rose to 22.7% from 12.5%. The 12.1-percentage-point fall in the West’s share coincided with a 10.2-percentage-point rise in the South, alongside smaller gains in North and Central India.
Know Krystal Integrated Services inside out
Results, valuation, peers and who's buying, in one view.
How did KRYSTAL’s geographic revenue mix change in FY26?
KRYSTAL’s geographic mix became less concentrated in the West in FY26, with the region’s contribution declining by 12.1 percentage points to 66.9% from 79.0% in FY25. The South added 10.2 percentage points to reach 22.7%, while North increased to 6.8% from 5.4% and Central rose to 3.7% from 3.1%.
KRYSTAL’s South share was 81.6% higher than its FY25 level when measured against the previous year’s share, increasing from 12.5% to 22.7%. The West nevertheless remained the largest geography at 66.9% in FY26, although its lead over the South narrowed to 44.2 percentage points from 66.5 percentage points in FY25.
What does the lower West share mean for KRYSTAL’s revenue concentration?
KRYSTAL still derived more than two-thirds of its FY26 geographic revenue mix from the West, but that was below the nearly four-fifths reported in FY25. The presentation provides regional percentages rather than rupee revenue for West, South, North or Central, so it shows a shift in mix rather than disclosed regional revenue amounts.
The South’s 10.2-percentage-point increase accounted for most of the West’s 12.1-percentage-point reduction. North and Central together added 2.0 percentage points, lifting their combined contribution to 10.5% in FY26 from 8.5% in FY25.
KRYSTAL’s disclosed FY26 shares total 100.1% because of rounding, compared with 100.0% in FY25. On those rounded figures, non-West geographies accounted for 33.2% of the FY26 mix, compared with 21.0% a year earlier.
Which business segments changed alongside KRYSTAL’s geographic mix?
KRYSTAL’s Integrated Facility Management Services, or IFMS, remained its largest revenue segment in FY26 at 41.49% of total income, but its share declined from 47.06% in FY25. Staffing represented 33.03%, down from 34.00%, while Food & Beverages increased to 12.53% from 6.09% and Waste Management rose to 3.88% from 2.18%.
Food & Beverages recorded the largest disclosed increase in the segment mix, rising by 6.44 percentage points in FY26. Waste Management increased by 1.70 percentage points, while Security declined to 9.07% from 10.67% and IFMS fell by 5.57 percentage points.
KRYSTAL said it had added Waste Management and Technical Facility Management as two new segments during the year. The revenue-mix table does not disclose a separate FY26 percentage for Technical Facility Management, whereas Waste Management, including TMC, VCMCC and CETP, represented 3.88% of total income.
Got a follow-up? Ask IRIS
How did KRYSTAL’s customer-sector mix move between FY25 and FY26?
KRYSTAL’s sectoral mix changed in FY26, led by healthcare declining to 11.3% from 28.4% in FY25, while retail, aviation and Banking, Financial Services and Insurance, or BFSI, increased. Retail rose to 23.3% from 20.8%, aviation reached 11.1% from 6.3%, and BFSI increased to 10.5% from 7.1%.
Healthcare’s 17.1-percentage-point reduction was larger than any increase among the listed sectors. Manufacturing & Industries increased by 1.0 percentage point to 8.8%, Education rose by 0.6 percentage point to 4.4%, and Residential & Commercial Properties increased by 0.8 percentage point to 3.6%.
Waste Water Management appeared as a 3.0% sector in FY26 but was not listed in FY25. Others represented 20.1% in FY26, up from 18.8%, while Facility Management was listed at 4.0% in FY26; the FY25 chart carries the Facility Management label without a stated percentage.
What financial trends accompanied KRYSTAL’s FY26 mix changes?
KRYSTAL reported revenue from operations of Rs 1,277.275 crore in FY26, compared with Rs 1,212.784 crore in FY25. Restated profit for the year increased to Rs 64.351 crore from Rs 62.515 crore, while restated profit before tax from continuing operations declined to Rs 74.926 crore from Rs 75.532 crore.
Trade receivable days increased to 118 in FY26 from 109 in FY25, and working-capital days rose to 101 from 94. Return on capital employed, or ROCE, was 17.63% in FY26 compared with 19.79% in FY25, while return on equity, or ROE, declined to 12.83% from 14.34%.
Borrowings, including current and non-current borrowings, were Rs 110.987 crore at March 2026, compared with Rs 83.969 crore at March 2025. Total debt to equity was 0.22 in FY26 and FY24, compared with 0.19 in FY25, according to KRYSTAL’s ratio series.
Conclusion
KRYSTAL’s FY26 figures show a redistribution of its reported geographic revenue mix, with the West falling to 66.9% from 79.0% and the South rising to 22.7% from 12.5%. The change came alongside a higher Food & Beverages share of 12.53%, a 3.88% Waste Management share, lower healthcare exposure of 11.3%, and higher retail, aviation and BFSI contributions.
The next point to watch is whether KRYSTAL’s stated addition of Waste Management and Technical Facility Management results in further disclosed changes to its revenue mix. The presentation gives no regional revenue target or timeline for West, South, North or Central, while FY26 working-capital days were 101 and trade receivable days were 118, both above FY25 levels.