










Krystal revenue mix shifts as IFMS drops to 41.49%
Key highlights
- Krystal’s IFMS share of total income fell from 71.04% in FY21 to 41.49% in FY26.
- Staffing represented 33.03% of Krystal’s FY26 total income, compared with 15.24% in FY21.
- Food and beverages increased from 0.73% of total income in FY21 to 12.53% in FY26.
- Waste management rose from 2.18% of total income in FY25 to 3.88% in FY26.
powered by IRIS
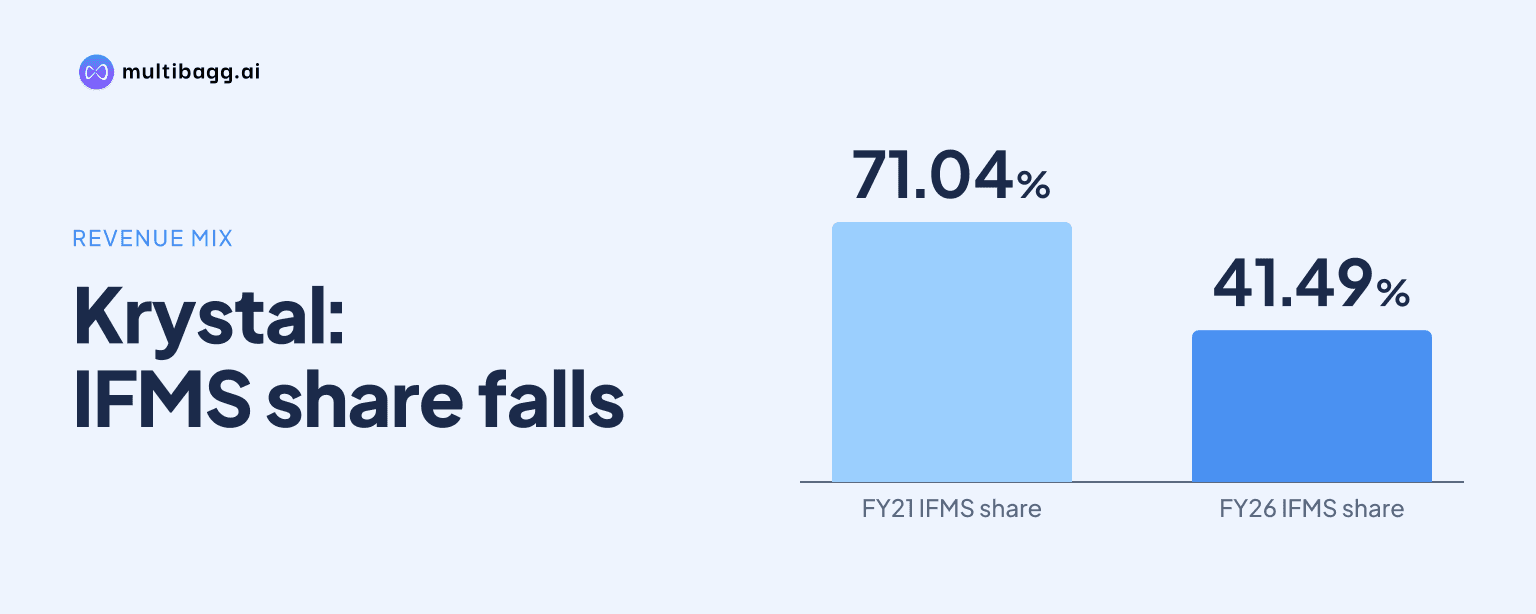
Krystal’s revenue mix became less dependent on the presentation’s IFMS line in financial year 2026 (FY26), when IFMS represented 41.49% of total income versus 71.04% in FY21. Staffing contributed 33.03%, food and beverages 12.53%, and waste management 3.88%, reflecting management’s stated effort to build diversified and sustainable revenue streams.
Know Krystal Integrated Services inside out
Results, valuation, peers and who's buying, in one view.
How has Krystal’s revenue mix changed since FY21?
Krystal moved from a mix led predominantly by IFMS in FY21 to one with larger staffing, food-and-beverages and waste-management contributions in FY26. IFMS lost 29.55 percentage points of total-income share, falling from 71.04% to 41.49%. Staffing gained 17.79 percentage points, rising from 15.24% to 33.03% and becoming the second-largest disclosed service line.
The movement was not a straight-line decline for every established line. IFMS increased from 58.46% in FY22 to 60.38% in FY23 before declining in each of the following three years. Staffing reached 34.00% in FY25 and then eased by 0.97 percentage points to 33.03% in FY26, while security declined from 12.98% in FY21 to 9.07% in FY26.
What made up Krystal’s FY26 revenue mix?
Krystal’s FY26 mix comprised 41.49% IFMS, 33.03% staffing, 12.53% food and beverages, 9.07% security and 3.88% waste management. Staffing, food and beverages, and waste management together represented 49.44% of total income, 7.95 percentage points above the reported IFMS share.
Food and beverages had the largest increase among the service lines disclosed from FY21, rising 11.80 percentage points from 0.73% to 12.53%. Its FY26 share was more than twice its FY25 contribution of 6.09%. Waste management was first separately shown at 2.18% in FY25 and increased to 3.88% in FY26.
Management said it further strengthened the portfolio during the year by adding waste management and technical facility management as new segments. The revenue-mix table separately reports waste management but provides no standalone percentage for technical facility management. Its contribution therefore cannot be isolated from the FY26 mix disclosure.
Which customer sectors and regions changed in FY26?
Krystal’s sectoral breakup changed most visibly in healthcare, retail and aviation between FY25 and FY26. Healthcare fell from 28.4% to 11.3%, while retail rose from 20.8% to 23.3% and aviation increased from 6.3% to 11.1%. Manufacturing and industries increased from 7.8% to 8.8%, and education rose from 3.8% to 4.4%.
The sectoral chart is distinct from the service-revenue chart, so its 4.0% FY26 facility-management category is not equivalent to IFMS’s 41.49% share of total income. The FY26 sectoral disclosure also includes wastewater management at 3.0%. Other sectors increased from 18.8% to 20.1%, while residential and commercial properties accounted for 3.6% in FY26.
Krystal’s geographic mix became less concentrated in the West, whose share fell from 79.00% in FY25 to 66.90% in FY26. The South increased from 12.50% to 22.70%, the North from 5.40% to 6.80%, and Central from 3.10% to 3.70%. This represented a 12.10-percentage-point reduction in the West’s share alongside a 10.20-percentage-point increase in the South’s share.
Got a follow-up? Ask IRIS
How does Krystal’s workforce support its service mix?
Krystal reported 49,971 on-site employees as of September 30, 2026, including 28,304 in IFMS and 16,635 in staffing. Security accounted for 4,878 on-site employees, while food and beverages had 154. Staffing was therefore the second-largest disclosed operational employee group, alongside its 33.03% FY26 share of total income.
Krystal reported 506 back-office staff and a core-to-associate ratio of 1:99 as of September 30, 2026. Its recruitment channels include print media, digital advertisements and job fairs. The presentation identifies Colonel (Retd.) Tushar Joshi as heading training and development, with in-house and on-site programmes based on customer needs and requirements.
Krystal had 547 customers, and 40% of its top 10 customers had been associated with it for more than 10 years. Listed customer areas include healthcare, city infrastructure, waste management, education, manufacturing and retail. The presentation does not provide revenue or margins by individual customer.
What financial indicators accompanied Krystal’s FY26 mix?
Krystal reported return on capital employed (ROCE) of 17.63% in FY26, compared with 19.79% in FY25 and 18.30% in FY24. The presentation defines ROCE as earnings before interest and tax divided by shareholders’ funds plus long-term borrowing less non-current investments. Return on equity was 12.83% in FY26, versus 14.34% in FY25.
Total debt to equity was 0.22 in FY26, compared with 0.19 in FY25 and 0.22 in FY24. Working-capital days increased to 101 in FY26 from 94 in FY25, while trade-receivable days rose to 118 from 109. The presentation reports these figures alongside the changing mix but does not attribute their movements to any service segment.
Conclusion
Krystal’s FY26 mix shows that IFMS remained its largest disclosed business but no longer represented a majority of total income. Staffing became a near-peer contributor at 33.03%, while food and beverages reached 12.53% after accounting for 0.73% in FY21. Waste management added a further 3.88% in FY26.
The next disclosure to watch is a separate revenue contribution for technical facility management, which management said it added alongside waste management during the year. Future results can also show whether staffing remains near its FY25 level of 34.00%, whether food and beverages extends its FY26 increase, and how working-capital days develop from 101 in FY26.