










Kuantum Papers margin falls to 12.8% as leverage rises
Key highlights
- Kuantum Papers’ EBITDA margin declined from 27.49% in FY24 to 12.80% in H1-FY27.
- Kuantum Papers’ EBITDA fell from Rs 333 crore in FY24 to Rs 161.8 crore in FY26.
- Kuantum Papers reported H1-FY27 profit after tax of Rs 8.5 crore and a 1.46% profit after tax margin.
- Kuantum Papers’ net debt-to-equity increased from 0.39x in FY24 to 0.73x in H1-FY27.
powered by IRIS
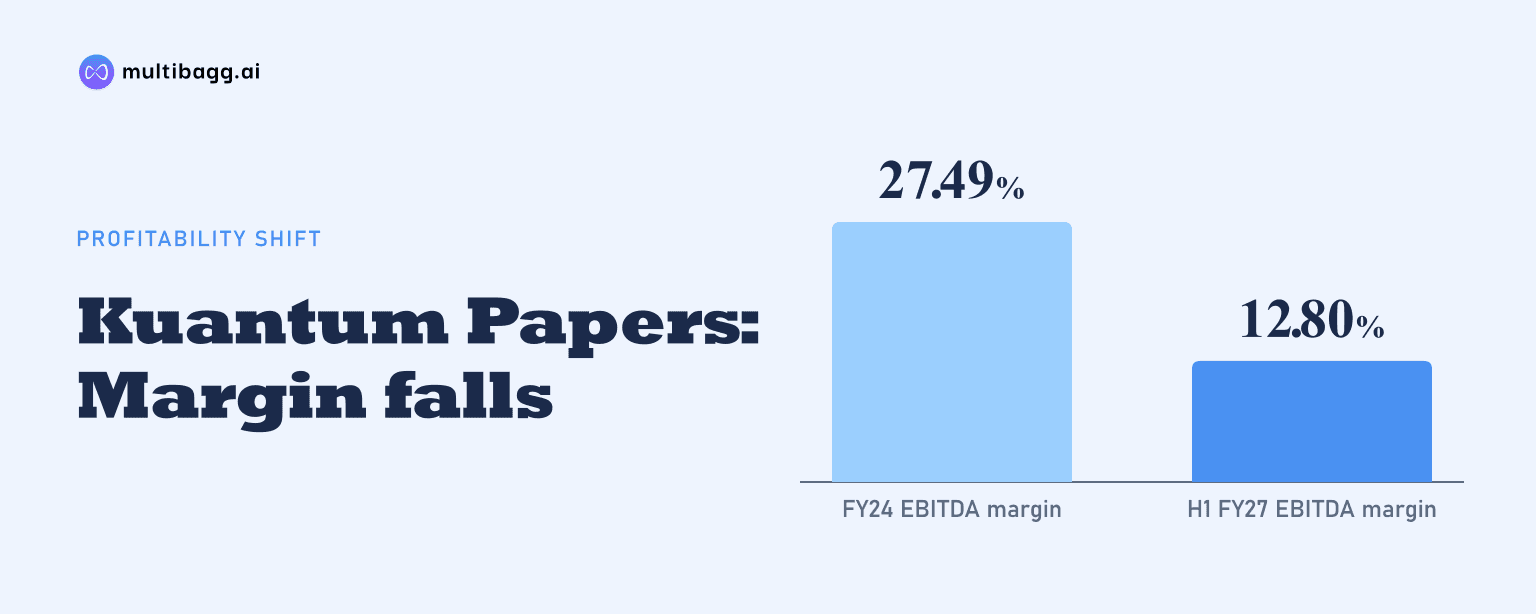
Kuantum Papers Limited reported a 12.80% earnings before interest, tax, depreciation and amortisation (EBITDA) margin in H1-FY27, down from 27.49% in FY24, while net debt-to-equity rose to 0.73x from 0.39x. EBITDA declined from Rs 333 crore in FY24 to Rs 74.6 crore in the six months of H1-FY27, and profit after tax margin reached 1.46%.
Know Kuantum Papers inside out
Results, valuation, peers and who's buying, in one view.
Why did Kuantum Papers’ EBITDA margin fall to 12.8%?
Kuantum Papers’ EBITDA margin declined in every reported period, falling from 27.49% in FY24 to 21.92% in FY25, 14.80% in FY26 and 12.80% in H1-FY27. Operational income decreased from Rs 1,211.3 crore in FY24 to Rs 1,093.2 crore in FY26, while EBITDA fell more sharply from Rs 333 crore to Rs 161.8 crore over those two full financial years.
Total expenses were Rs 878.3 crore against operational income of Rs 1,211.3 crore in FY24, compared with Rs 931.4 crore against Rs 1,093.2 crore in FY26. In H1-FY27, Kuantum Papers reported Rs 582.9 crore of operational income and Rs 508.3 crore of total expenses, leaving EBITDA of Rs 74.6 crore. The presentation does not break down expenses by raw materials, energy, selling costs or other operating categories, so it does not specify the source of the margin compression.
H1-FY27 covers six months, so its income and EBITDA amounts are not directly comparable with the three full-year periods. Its 12.80% EBITDA margin is, however, 2 percentage points below the FY26 full-year margin of 14.80%. The FY24-to-FY26 comparison shows operational income declining by Rs 118.1 crore, while EBITDA declined by Rs 171.2 crore.
How far has Kuantum Papers’ profit after tax declined?
Kuantum Papers’ profit after tax declined from Rs 183.8 crore in FY24 to Rs 42 crore in FY26 and Rs 8.5 crore in H1-FY27. Profit after tax margin moved from 15.17% in FY24 to 10.41% in FY25, 3.84% in FY26 and 1.46% in H1-FY27, following the reduction in EBITDA across the disclosed periods.
Profit before tax was Rs 247.6 crore in FY24, Rs 155.4 crore in FY25, Rs 56.6 crore in FY26 and Rs 12 crore in H1-FY27. Depreciation increased from Rs 48.2 crore in FY24 to Rs 65.3 crore in FY26, while finance cost rose from Rs 42.8 crore to Rs 46.4 crore. H1-FY27 depreciation was Rs 37.4 crore and finance cost was Rs 31.1 crore, but these are half-year figures rather than full-year results.
The company reported tax of Rs 63.8 crore in FY24, Rs 40.2 crore in FY25, Rs 14.6 crore in FY26 and Rs 3.5 crore in H1-FY27. Diluted earnings per share were Rs 21.07 in FY24, Rs 13.20 in FY25, Rs 4.81 in FY26 and Rs 0.97 in H1-FY27. The presentation reports no exceptional items in any of the four periods.
Got a follow-up? Ask IRIS
How has Kuantum Papers’ leverage changed?
Kuantum Papers’ reported net debt-to-equity ratio increased from 0.39x in FY24 to 0.52x in FY25, 0.66x in FY26 and 0.73x in H1-FY27. Net worth rose from Rs 1,123.8 crore in FY24 to Rs 1,228.3 crore in FY26, before decreasing to Rs 1,215 crore at the H1-FY27 reporting date.
Balance-sheet borrowings increased between FY25 and H1-FY27 while total equity remained near Rs 1,200 crore. Non-current borrowings rose from Rs 402.7 crore in FY25 to Rs 589.7 crore in FY26 and Rs 708.7 crore in H1-FY27. Current borrowings were Rs 250.9 crore, Rs 270.1 crore and Rs 252.9 crore, respectively, taking total borrowings to Rs 961.6 crore in H1-FY27.
Cash and cash equivalents increased from Rs 9.2 crore in FY25 to Rs 40.9 crore in FY26 and Rs 60.8 crore in H1-FY27. Total liabilities nevertheless increased from Rs 900.1 crore in FY25 to Rs 1,170.6 crore in FY26 and Rs 1,344.5 crore in H1-FY27. The presentation reports net debt-to-equity but does not provide a reconciliation defining net debt.
What do Kuantum Papers’ working capital and assets show?
Kuantum Papers’ cash conversion cycle improved to 75 days in FY26 from 92 days in FY25, but remained above the 56 days reported in FY24. The FY26 cycle was therefore 17 days shorter than FY25 and 19 days longer than FY24. The presentation does not disclose a cash conversion cycle for H1-FY27.
Current assets rose from Rs 255.6 crore in FY26 to Rs 293.4 crore in H1-FY27, while current liabilities increased from Rs 386 crore to Rs 430.9 crore. Inventories increased from Rs 131.4 crore to Rs 150.2 crore over that period, while trade receivables fell from Rs 44.3 crore to Rs 29.8 crore. Trade payables rose from Rs 64 crore to Rs 105.9 crore.
Property, plant and equipment increased from Rs 1,601.3 crore in FY25 to Rs 1,809.9 crore in FY26 and Rs 2,066 crore in H1-FY27. Capital work-in-progress increased from Rs 155.2 crore in FY25 to Rs 262.5 crore in FY26, then declined to Rs 139 crore in H1-FY27. Total assets reached Rs 2,559.5 crore in H1-FY27, compared with Rs 2,398.9 crore in FY26.
Conclusion
Kuantum Papers’ reported financial trend combines a declining operating margin with lower net profit and rising leverage. Operational income fell by Rs 118.1 crore between FY24 and FY26, but EBITDA declined by Rs 171.2 crore, reducing the margin from 27.49% to 14.80%. H1-FY27 extended the pattern with a 12.80% EBITDA margin, a 1.46% profit after tax margin and net debt-to-equity of 0.73x.
The next reported period will show whether Kuantum Papers can reverse the H1-FY27 pattern, in which Rs 508.3 crore of expenses accompanied Rs 582.9 crore of operational income. The presentation discloses no earnings target, debt-reduction target or detailed explanation of operating-cost movements, while property, plant and equipment had risen to Rs 2,066 crore by H1-FY27.