










LAPL EBITDA margin more than doubled as FY26 PAT nearly quadrupled
Key highlights
- LAPL’s EBITDA margin rose from 8.81% in FY24 to 16.75% in FY26.
- LAPL reported FY26 revenue from operations of Rs 93.2517 crore, versus Rs 60.7348 crore in FY24.
- LAPL’s FY26 PAT was Rs 8.6269 crore, compared with Rs 2.1737 crore in FY24.
- LAPL’s debt-to-equity ratio declined from 1.15 times in FY24 to 0.83 times in FY26.
powered by IRIS
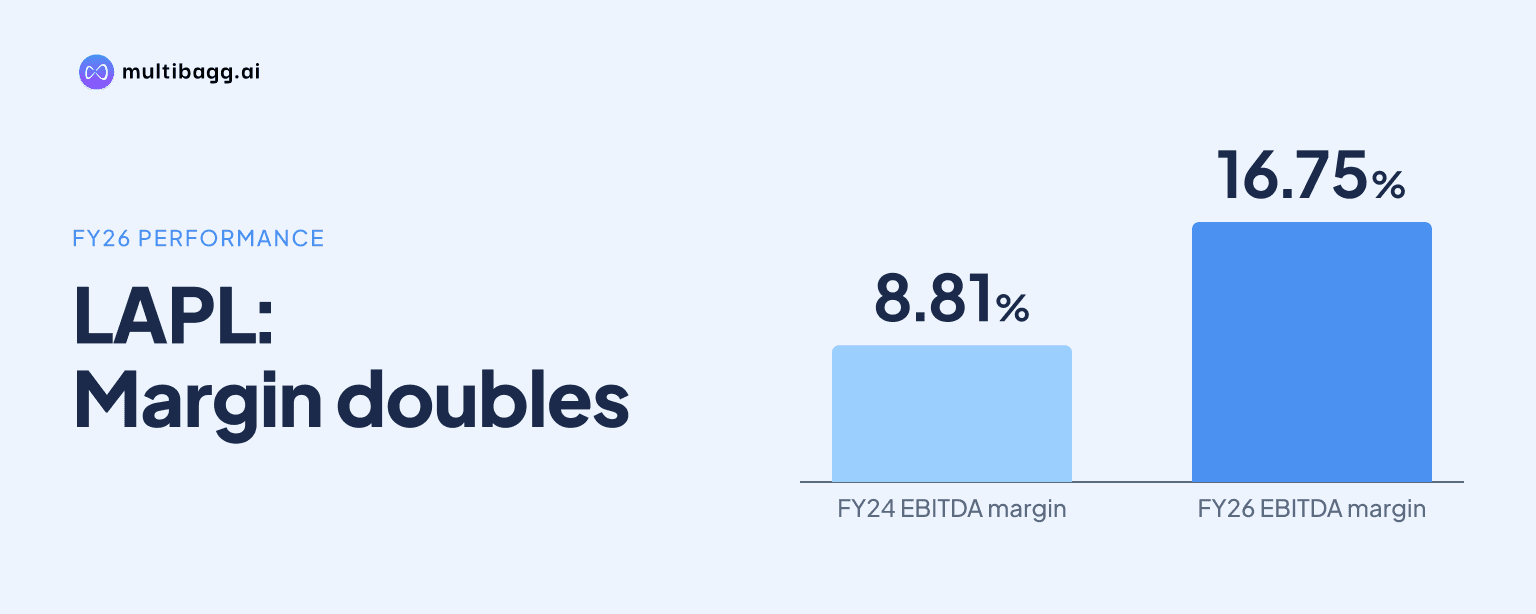
LAPL Automotive Limited more than doubled its earnings before interest, tax, depreciation and amortisation (EBITDA) margin to 16.75% in FY26 from 8.81% in FY24, while profit after tax (PAT) rose to Rs 8.6269 crore from Rs 2.1737 crore. Revenue from operations reached Rs 93.2517 crore in FY26.
Know LAPL Automotive inside out
Results, valuation, peers and who's buying, in one view.
How did LAPL’s profitability change between FY24 and FY26?
LAPL’s profitability increased across each of the three reported financial years, with EBITDA margin rising by 7.94 percentage points from 8.81% in FY24 to 16.75% in FY26. EBITDA increased from Rs 5.3766 crore in FY24 to Rs 9.9359 crore in FY25 and Rs 15.7957 crore in FY26. PAT margin rose over the same period from 3.58% to 7.63% and then 9.25%.
PAT was nearly four times its FY24 level by FY26, increasing by Rs 6.4532 crore to Rs 8.6269 crore. Profit before tax rose from Rs 3.1221 crore in FY24 to Rs 11.6795 crore in FY26, despite interest costs increasing from Rs 87.36 lakh to Rs 1.5877 crore and depreciation and amortisation increasing from Rs 1.3809 crore to Rs 2.5285 crore.
LAPL’s presentation links its strategy to a shift towards value-added, technology-driven products including LED and projector lighting, brushless direct-current (BLDC) motors and high-efficiency motors. The company states that its LED lighting portfolio can serve internal-combustion-engine and electric-vehicle platforms, and that it has secured electric-vehicle customers in commercial-vehicle and two-wheeler segments, without disclosing associated revenue.
How much did LAPL’s revenue and earnings grow in FY26?
LAPL’s revenue from operations increased to Rs 93.2517 crore in FY26 from Rs 65.9753 crore in FY25 and Rs 60.7348 crore in FY24. The Rs 27.2764 crore increase in FY26 was larger than the Rs 5.2405 crore rise recorded in FY25. Total income also increased, reaching Rs 94.3154 crore in FY26 against Rs 67.0728 crore in FY25 and Rs 61.0339 crore in FY24.
LAPL’s operating expenses rose to Rs 78.5197 crore in FY26 from Rs 57.1369 crore in FY25 and Rs 55.6573 crore in FY24. Revenue increased by Rs 32.5169 crore between FY24 and FY26, while operating expenses increased by Rs 22.8624 crore, accompanying the increase in EBITDA. Earnings per share also rose from Rs 2.47 in FY24 to Rs 5.72 in FY25 and Rs 9.80 in FY26.
Got a follow-up? Ask IRIS
How did LAPL’s returns and leverage move through FY26?
LAPL reported higher return on equity (RoE) and return on capital employed (RoCE) in each year through FY26, while debt-to-equity declined. RoE increased from 20.69% in FY24 to 35.68% in FY25 and 41.20% in FY26. RoCE rose from 21.65% to 30.85% and then 34.37% over the same three years.
LAPL’s FY26 RoCE of 34.37% was shown alongside 26.65% for Fiem Industries and 12.86% for Minda Corp in the presentation. Its FY26 RoE of 41.20% was compared with 22.69% for Fiem Industries and 14.79% for Minda Corp. The presentation displays these peer figures but does not give their calculation periods or methodology.
LAPL’s debt-to-equity ratio moved below one time in FY25 and declined further to 0.83 times in FY26, from 1.15 times in FY24. The current ratio was 1.12 times in FY26, compared with 1.02 times in FY25 and 1.04 times in FY24. Net asset value per share rose by Rs 15.53 over the two-year period to Rs 28.70.
What balance-sheet changes accompanied LAPL’s FY26 growth?
LAPL’s total assets increased to Rs 62.6775 crore in FY26 from Rs 44.3419 crore in FY25 and Rs 32.7926 crore in FY24. Property, plant and equipment rose to Rs 22.6095 crore in FY26 from Rs 9.8271 crore in FY24, while capital work-in-progress declined to Rs 91.57 lakh from Rs 6.448 crore. The balance-sheet presentation therefore shows more of the asset base in completed property, plant and equipment by FY26.
Working-capital balances increased with revenue. Inventories rose from Rs 6.1036 crore in FY24 to Rs 15.7416 crore in FY26, while trade receivables increased from Rs 6.9401 crore to Rs 19.4333 crore. Trade payables increased from Rs 5.7843 crore to Rs 12.5724 crore, and short-term borrowings rose from Rs 7.655 crore to Rs 17.4193 crore.
Net worth reached Rs 25.2528 crore in FY26, up from Rs 11.5914 crore in FY24, comprising Rs 8.8 crore of equity and Rs 16.4528 crore of reserves and surplus. Long-term borrowings declined to Rs 3.5701 crore from Rs 5.7106 crore over the same period, while cash and bank balances were Rs 19.27 lakh in FY26 compared with Rs 2.4697 crore in FY24.
Conclusion
LAPL’s FY24-to-FY26 figures show revenue growth alongside higher EBITDA and PAT margins, rising reported return measures and a lower debt-to-equity ratio. FY26 revenue was Rs 93.2517 crore, EBITDA was Rs 15.7957 crore and PAT was Rs 8.6269 crore, while inventories, receivables, payables and short-term borrowings also increased during the period.
What to watch next is management’s stated plan to build a new manufacturing facility using Rs 19.56 crore, increase automation and in-house production, and reduce outsourcing. Management also plans to expand original-equipment-manufacturer engagement, LED and projector lighting, BLDC motors, distributor networks and aftermarket channels, although the presentation does not disclose a completion date, capacity addition or financial target for these initiatives.