










mastertrust Principal Strategies led Q2 FY27 revenue at 42.43%
Key highlights
- mastertrust reported Rs 153.678 crore of total revenue in Q2 FY27, up 21.1% from Rs 126.866 crore in Q2 FY26.
- Principal Strategies contributed Rs 65.206 crore, or 42.43%, of mastertrust’s Q2 FY27 revenue.
- MTF and allied revenue increased to Rs 14.779 crore in Q2 FY27 from Rs 11.224 crore in Q1 FY27.
- Interest income reached Rs 30.752 crore in Q2 FY27, its highest amount in the six-quarter table.
powered by IRIS
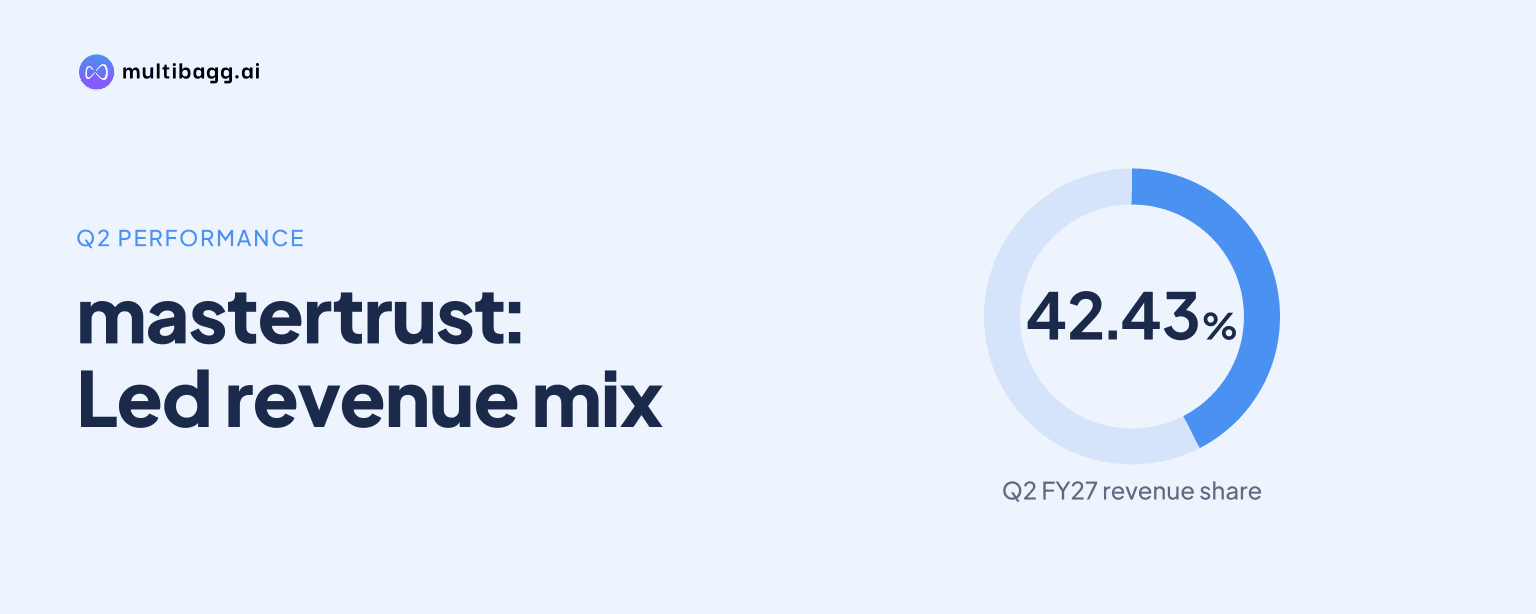
In Q2 FY27, mastertrust reported Rs 153.678 crore of revenue, with Principal Strategies contributing Rs 65.206 crore, or 42.43%, to remain its largest income stream. The segment was ahead of brokerage and allied revenue at Rs 35.145 crore, or 22.87%, and interest income at Rs 30.752 crore, or 20.01%.
Know Master Trust inside out
Results, valuation, peers and who's buying, in one view.
What made mastertrust Principal Strategies the largest Q2 FY27 revenue stream?
Principal Strategies was mastertrust’s largest Q2 FY27 revenue stream because it generated Rs 65.206 crore, representing 42.43% of total revenue of Rs 153.678 crore. Brokerage and allied revenue was the second-largest identified line at Rs 35.145 crore and 22.87%, while interest income contributed Rs 30.752 crore and 20.01%. Principal Strategies therefore exceeded brokerage and allied revenue by 19.56 percentage points of total revenue.
The segment operates through a separate trading desk that uses the company’s own capital across market opportunities. mastertrust says the desk has been active since 2010-11 and was expanded from 2021 as market activity and available capital increased. The presentation reports Rs 520 crore of capital deployed in Principal Strategies in Q2 FY27 and return on capital employed of 19.88%.
Principal Strategies led the revenue mix in every displayed quarter from Q2 FY26 through Q2 FY27. Its share increased from 38.02% in Q2 FY26 to 54.05% in Q4 FY26, before declining to 44.24% in Q1 FY27 and 42.43% in Q2 FY27. The latest share was 4.41 percentage points above Q2 FY26 but 11.62 percentage points below the Q4 FY26 high.
How did mastertrust’s total revenue change over six quarters?
mastertrust’s Q2 FY27 revenue of Rs 153.678 crore was 21.1% above Rs 126.866 crore in Q2 FY26 and 2.6% above Rs 149.794 crore in Q1 FY27. Total revenue remained below the six-quarter high of Rs 180.608 crore recorded in Q4 FY26. The sequential increase in Q2 FY27 followed the decline from Q4 FY26 to Q1 FY27.
The table uses Rs crore throughout. Non-banking financial company income is shown as NBFC Income, while asset management is shown as portfolio management services, or PMS.
Principal Strategies reached its highest displayed quarterly revenue of Rs 97.619 crore in Q4 FY26, when its revenue share was also highest at 54.05%. Its Q2 FY27 revenue was Rs 32.413 crore below that level. By contrast, interest income reached its highest displayed amount of Rs 30.752 crore in Q2 FY27, while MTF and allied income reached Rs 14.779 crore, also its highest amount in the six-quarter series.
Which mastertrust revenue lines changed most in Q2 FY27?
MTF and allied was the largest sequential gainer among the principal revenue lines, increasing by Rs 3.555 crore from Rs 11.224 crore in Q1 FY27 to Rs 14.779 crore in Q2 FY27. Its revenue mix rose by 2.13 percentage points, from 7.49% to 9.62%. Interest income increased by Rs 1.869 crore to Rs 30.752 crore, and its mix share increased by 0.73 percentage points to 20.01%.
Principal Strategies declined by Rs 1.059 crore sequentially from Rs 66.265 crore, and its mix share fell by 1.81 percentage points from 44.24%. Brokerage and allied income fell by Rs 2.211 crore from Rs 37.356 crore to Rs 35.145 crore, with its share declining from 24.94% to 22.87%. Other Income increased by Rs 1.135 crore to Rs 1.446 crore, helping total revenue rise by Rs 3.884 crore despite the declines in the two largest revenue lines.
Year on year, Principal Strategies revenue increased by Rs 16.972 crore from Rs 48.234 crore in Q2 FY26, while its share increased by 4.41 percentage points. Brokerage and allied revenue rose by Rs 3.661 crore from Q2 FY26, although its mix share fell by 1.95 percentage points. Interest income increased by Rs 4.915 crore year on year, but its revenue share edged down from 20.37% to 20.01% as total revenue grew.
Got a follow-up? Ask IRIS
How do mastertrust’s wealth and investment products fit the revenue mix?
mastertrust reported Rs 1.735 crore of wealth management revenue and Rs 1.928 crore of PMS income in Q2 FY27. Wealth management had 10,927 clients, Rs 1,147.70 crore of assets under wealth management and 18,362 active systematic investment plans. PMS had Rs 446.064 crore of assets under management and 278 clients, while its revenue mix was 1.25% in Q2 FY27 compared with 1.26% in Q1 FY27.
Mutual funds generated Rs 1.340 crore of Q2 FY27 income on Rs 907.960 crore of distribution assets under management and 10,787 investors. Other product distribution, covering PMS, alternative investment funds, fixed income and debt solutions, generated Rs 0.269 crore of income on Rs 239.740 crore of assets under management and 140 investors. These product metrics are presented separately from the segmental table, which includes wealth management, insurance broking, professional income and other income within Others.
Insurance broking generated Rs 0.484 crore in Q2 FY27, compared with Rs 0.920 crore in Q1 FY27 and Rs 1.115 crore in Q2 FY26. The business collected Rs 3.253 crore of premium and served 545 insurance customers in Q2 FY27. Wealth management revenue increased from Rs 0.993 crore in Q1 FY27 to Rs 1.735 crore in Q2 FY27, although it remained below Rs 2.167 crore in Q4 FY26.
What is mastertrust building alongside its existing revenue streams?
mastertrust has recently launched derivatives clearing services for professional and high-volume market participants, foreign portfolio investors, mutual funds, Category III alternative investment funds, registered portfolio managers and customers maintaining large margins with the group. The presentation cites Rs 50 crore as the minimum net-worth requirement for a professional clearing member under 2026 rules of the Securities and Exchange Board of India. It does not disclose derivatives clearing-services revenue for Q2 FY27.
Institutional broking recorded Rs 3,497.26 crore of trading volume, Rs 1.129 crore of brokerage revenue and 59 institutional clients in Q2 FY27. This revenue represented 4.30% of total brokerage, while the broader brokerage and allied line generated Rs 35.145 crore. Digital brokerage revenue share was 52% in Q2 FY27, down from 56% in Q1 FY27 and 60% in Q2 FY26, alongside 27,759 monthly active digital users and 6.08 million digitally executed orders.
Conclusion
mastertrust’s Q2 FY27 revenue remained concentrated in Principal Strategies, which accounted for 42.43% of revenue despite a Rs 1.059 crore sequential decline. Higher MTF and allied income of Rs 14.779 crore, interest income of Rs 30.752 crore and Other Income of Rs 1.446 crore supported a 2.6% sequential increase in total revenue to Rs 153.678 crore.
The next result periods will show whether Principal Strategies moves closer to its Q4 FY26 revenue of Rs 97.619 crore and whether the recently launched derivatives clearing business begins to report income. The presentation leaves clearing revenue unresolved, while reporting Rs 520 crore of Principal Strategies capital deployed and a 52% digital share of brokerage revenue in Q2 FY27.