










mastertrust Q2 profit rises 22% as EBITDA margin reaches 43.19%
Key highlights
- mastertrust Q2 FY27 net profit was Rs 38.297 crore, up 21.94% year on year.
- mastertrust EBITDA rose 10.60% sequentially to Rs 66.366 crore in Q2 FY27.
- mastertrust EBITDA margin increased to 43.19% from 40.06% in Q1 FY27.
- mastertrust borrowings rose to Rs 383.558 crore from Rs 231.864 crore at Q1 FY27.
powered by IRIS
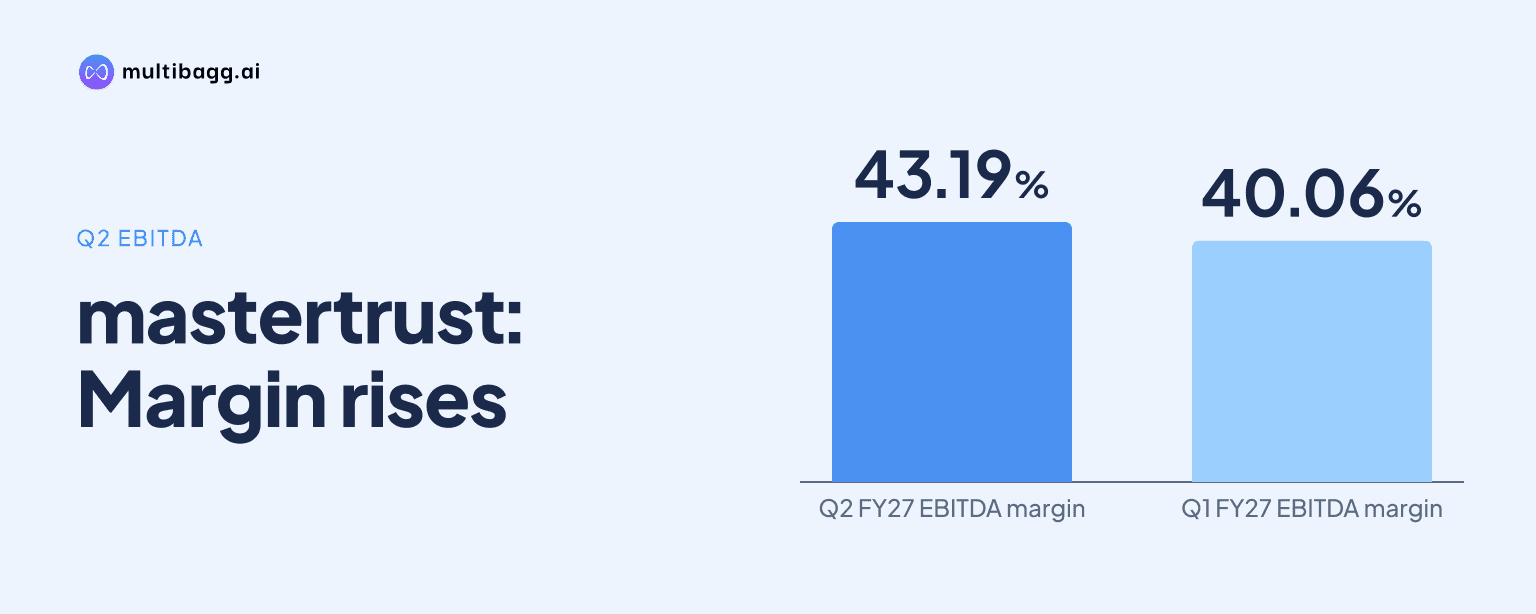
mastertrust reported Q2 FY27 net profit of Rs 38.297 crore, up 21.94% year on year and 10.52% sequentially, while earnings before interest, tax, depreciation and amortisation (EBITDA) margin rose to 43.19% from 40.06% in Q1 FY27. Total income increased 21.13% year on year to Rs 153.678 crore.
Know Master Trust inside out
Results, valuation, peers and who's buying, in one view.
What drove mastertrust's Q2 FY27 profit growth?
mastertrust's Q2 FY27 profit growth was supported by a Rs 6.358 crore sequential increase in EBITDA and a Rs 2.475 crore decline in total expenditure. Net profit reached Rs 38.297 crore, compared with Rs 34.652 crore in Q1 FY27 and Rs 31.406 crore in Q2 FY26. Profit before tax (PBT) was Rs 50.799 crore, up 9.86% quarter on quarter and 17.46% year on year.
Total income was Rs 153.678 crore in Q2 FY27, against Rs 149.794 crore in Q1 FY27 and Rs 126.866 crore a year earlier. Employee cost declined to Rs 28.993 crore from Rs 29.602 crore in Q1 FY27, while other expenses fell to Rs 58.318 crore from Rs 60.184 crore. Total expenditure, however, was above Rs 68.875 crore in Q2 FY26.
Interest expense increased to Rs 14.553 crore from Rs 12.729 crore in Q1 FY27 and Rs 13.650 crore in Q2 FY26. Tax expense, including deferred tax, was Rs 12.502 crore, versus Rs 11.587 crore in the previous quarter. Depreciation was Rs 1.013 crore, compared with Rs 1.040 crore sequentially, leaving the operating-profit improvement partly offset by higher financing cost.
How did mastertrust's income mix change in Q2 FY27?
mastertrust's principal strategies remained the largest income category at Rs 65.206 crore in Q2 FY27, although its share of total income declined sequentially. Principal strategies represented 42.43% of income, down from 44.24% in Q1 FY27 but above 38.02% in Q2 FY26. The category's reported income was Rs 66.265 crore in the previous quarter and Rs 48.234 crore a year earlier.
Brokerage and allied income was Rs 35.145 crore, down from Rs 37.356 crore in Q1 FY27 but up from Rs 31.484 crore in Q2 FY26. Its contribution to income fell to 22.87% from 24.94% sequentially and 24.82% year on year. The presentation's other-income grouping rose to 34.70% of total income from 30.82% in Q1 FY27.
Interest income increased to Rs 30.752 crore from Rs 28.883 crore in Q1 FY27 and Rs 25.837 crore in Q2 FY26. Margin trading facility (MTF) and allied income grew to Rs 14.779 crore from Rs 11.224 crore sequentially and Rs 11.391 crore year on year. Non-banking financial company (NBFC) income was Rs 2.203 crore, compared with Rs 1.951 crore in Q1 FY27 and Rs 4.871 crore in Q2 FY26.
Wealth-management income increased to Rs 1.735 crore from Rs 0.993 crore sequentially, but was below Rs 1.840 crore a year earlier. Asset-management income from portfolio management services (PMS) was Rs 1.928 crore, close to Rs 1.891 crore in Q1 FY27 and below Rs 2.040 crore in Q2 FY26. Insurance-broking income fell to Rs 0.484 crore from Rs 0.920 crore sequentially and Rs 1.115 crore year on year.
Got a follow-up? Ask IRIS
Why did mastertrust's EBITDA margin recover in Q2 FY27?
mastertrust's EBITDA margin recovered because EBITDA rose 10.60% sequentially to Rs 66.366 crore while total income rose 2.59% to Rs 153.678 crore. The margin increased 3.13 percentage points from 40.06% in Q1 FY27. It remained 2.52 percentage points below the 45.71% recorded in Q2 FY26.
The Q2 FY27 margin also reversed part of the decline seen in Q4 FY26, when EBITDA margin was 34.20%. EBITDA then improved to Rs 60.008 crore and a 40.06% margin in Q1 FY27 before reaching Rs 66.366 crore in Q2 FY27. Across these three quarters, total income moved from Rs 180.608 crore in Q4 FY26 to Rs 149.794 crore and then Rs 153.678 crore.
Net profit margin followed the sequential operating trend, rising to 24.92% from 23.13% in Q1 FY27 and edging above 24.76% in Q2 FY26. PBT increased by Rs 4.560 crore quarter on quarter, less than the Rs 6.358 crore EBITDA increase because interest expense rose by Rs 1.824 crore. The presentation therefore shows both lower operating costs and a higher interest charge during the quarter.
For the full year, mastertrust reported FY26 EBITDA of Rs 229.376 crore and a 39.83% margin, compared with Rs 237.736 crore and a 40.71% margin in FY25. FY26 net profit was Rs 126.087 crore, down from Rs 131.237 crore in FY25, while total income declined to Rs 575.844 crore from Rs 583.942 crore. Q2 FY27's 43.19% EBITDA margin was above both FY25 and FY26 annual margins.
How did mastertrust's balance sheet change in Q2 FY27?
mastertrust's consolidated balance sheet total increased to Rs 2,423.838 crore at Q2 FY27 from Rs 2,269.838 crore at Q1 FY27 and Rs 2,064.110 crore at Q2 FY26. Financial assets were Rs 2,387.941 crore, while non-financial assets were Rs 35.896 crore. Cash and bank balances remained the largest asset line at Rs 1,854.854 crore.
Borrowings increased to Rs 383.558 crore from Rs 231.864 crore at Q1 FY27 and Rs 162.780 crore at Q2 FY26. Total financial liabilities rose to Rs 1,507.940 crore from Rs 1,387.685 crore sequentially, although trade payables fell to Rs 997.547 crore from Rs 1,021.139 crore. Other financial liabilities declined to Rs 126.835 crore from Rs 134.683 crore.
Loans and advances rose to Rs 71.822 crore from Rs 33.825 crore at Q1 FY27, while trade receivables increased to Rs 280.225 crore from Rs 203.308 crore. Cash and bank balances increased by Rs 36.682 crore sequentially to Rs 1,854.854 crore. Investments were Rs 33.605 crore, slightly below Rs 34.644 crore in Q1 FY27.
Total equity increased to Rs 894.957 crore from Rs 857.292 crore in Q1 FY27 and Rs 755.505 crore in Q2 FY26. Other equity was Rs 880.837 crore at the Q2 FY27 reporting date, compared with Rs 843.182 crore a quarter earlier. Non-financial liabilities declined to Rs 20.940 crore from Rs 24.860 crore, including provisions of Rs 14.845 crore.
Conclusion
mastertrust's Q2 FY27 results combined higher income with lower sequential employee and other expenses, lifting EBITDA faster than revenue and raising net profit to Rs 38.297 crore. Principal strategies remained the largest income category, while MTF and allied income rose both sequentially and year on year. The balance sheet also expanded, with higher cash, receivables, loans and advances alongside a Rs 151.694 crore sequential increase in borrowings.
Next, management's disclosed plan is to expand lending through the group's NBFC and non-convertible debenture markets while working to improve its credit rating and lower funding costs. The presentation also lists planned TradingView-chart enhancements, including a Scalper interface, seconds-based intervals and advanced options analytics, and identifies derivatives clearing services for specified client groups as recently launched.