










MMP balance sheet expands to Rs 734.6 crore in September 2026
Key highlights
- MMP’s total assets and total liabilities reached Rs 734.6 crore at Sep-26, up Rs 109.7 crore from Mar-26.
- Long-term borrowings rose to Rs 83.8 crore at Sep-26 from Rs 43.2 crore at Mar-26.
- Trade receivables increased to Rs 115.6 crore and inventories reached Rs 174.8 crore at Sep-26.
- MMP reported Rs 22.8 crore of operating cash flow and a Rs 52.9 crore investing outflow for Sep-26.
powered by IRIS
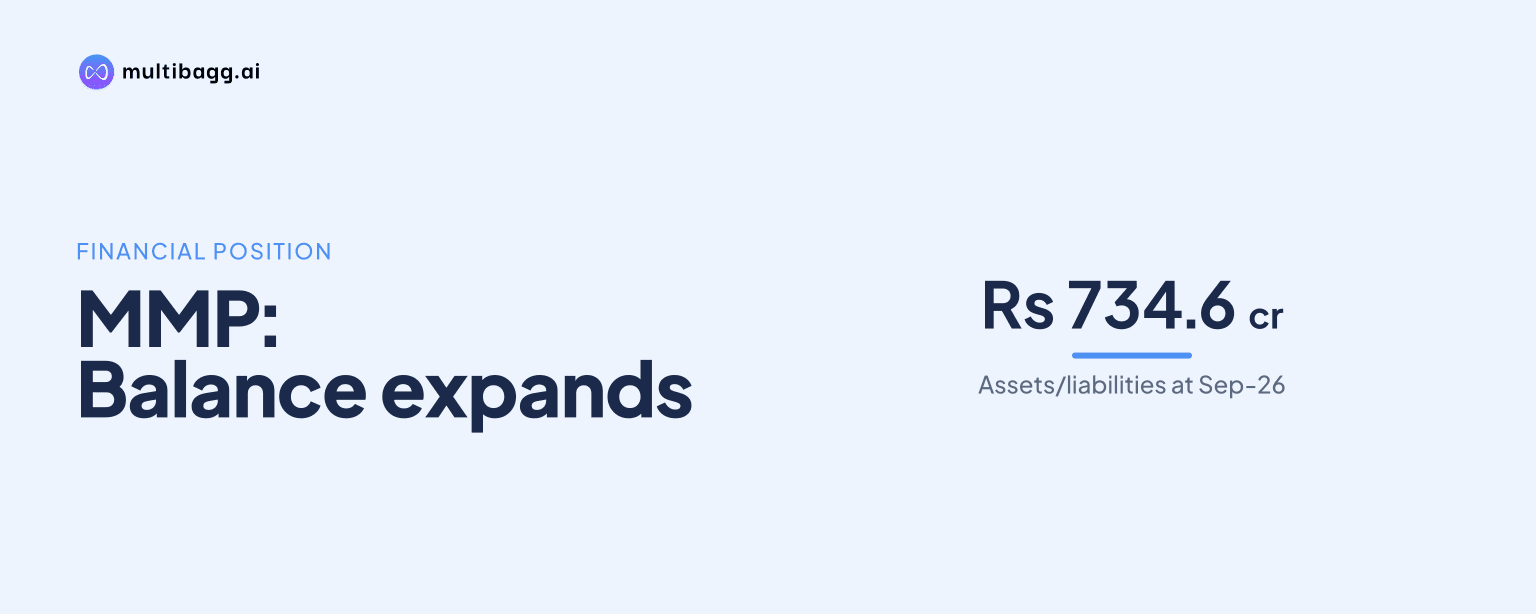
MMP Industries Ltd’s consolidated balance sheet total reached Rs 734.6 crore at Sep-26, up Rs 109.7 crore from Rs 624.9 crore at Mar-26, as long-term borrowings rose to Rs 83.8 crore, trade receivables reached Rs 115.6 crore and capital work in progress increased to Rs 55.6 crore.
Know MMP Industries inside out
Results, valuation, peers and who's buying, in one view.
How did MMP’s balance sheet change by Sep-26?
MMP’s total assets and total liabilities each increased by Rs 109.7 crore in the six months to Sep-26, reaching Rs 734.6 crore from Rs 624.9 crore at Mar-26. This followed a Rs 75.9 crore increase during FY26 from Rs 549.0 crore at Mar-25. Shareholders’ funds rose to Rs 374.5 crore at Sep-26 from Rs 346.5 crore at Mar-26, as reserves and surplus increased from Rs 321.1 crore to Rs 349.1 crore while share capital remained Rs 25.4 crore.
Non-current investment, the presentation’s label for non-current assets, increased by Rs 63.3 crore to Rs 422.8 crore during the six-month period. Current assets rose by Rs 46.4 crore to Rs 311.8 crore. The expansion was therefore weighted towards non-current assets, although current assets also increased materially.
Why did MMP’s borrowings rise by Sep-26?
MMP’s long-term borrowings increased by Rs 40.6 crore to Rs 83.8 crore at Sep-26 from Rs 43.2 crore at Mar-26. Short-term borrowings also rose by Rs 11.0 crore to Rs 152.3 crore. Combined reported long-term and short-term borrowings were Rs 236.1 crore at Sep-26, compared with Rs 184.5 crore six months earlier.
The larger movement was in long-term borrowings, while total non-current liabilities increased to Rs 108.3 crore from Rs 67.1 crore. The Sep-26 non-current-liability balance included Rs 19.6 crore of other non-current liabilities and Rs 4.9 crore of long-term provisions. Total current liabilities rose to Rs 251.7 crore, with trade payables increasing by Rs 16.1 crore to Rs 62.3 crore and other current liabilities rising by Rs 13.4 crore to Rs 35.0 crore.
For FY26, MMP reported net debt to equity of 0.5 times, compared with 0.4 times in FY25 and 0.3 times in FY24. Finance cost increased to Rs 13.3 crore in FY26 from Rs 10.2 crore in FY25, while long-term borrowings rose to Rs 43.2 crore from Rs 32.1 crore over the same year. The presentation does not provide a net-debt-to-equity figure for Sep-26.
What changed in MMP’s receivables, inventory and project assets?
MMP’s trade receivables increased by Rs 26.8 crore to Rs 115.6 crore at Sep-26 from Rs 88.8 crore at Mar-26. Inventories increased by Rs 16.7 crore to Rs 174.8 crore over the same period. Together, receivables and inventories were Rs 290.4 crore at Sep-26, compared with Rs 246.9 crore at Mar-26.
Capital work in progress, or CWIP, increased by Rs 17.3 crore to Rs 55.6 crore during the six months. Property, plant and equipment and intangible assets rose by Rs 8.8 crore to Rs 259.0 crore. Financial assets increased by Rs 17.3 crore to Rs 77.3 crore, while other non-current assets rose by Rs 20.0 crore to Rs 30.9 crore.
The Sep-26 receivables movement differed from FY26, when trade receivables edged down to Rs 88.8 crore at Mar-26 from Rs 89.5 crore at Mar-25, even as inventory rose by Rs 23.2 crore to Rs 158.1 crore. By Sep-26, receivables had exceeded both the Mar-26 and Mar-25 balances. Revenue from operations was Rs 485.3 crore in H1FY27, while the balance sheet is dated Sep-26; the presentation does not provide receivables-days or inventory-days measures.
Got a follow-up? Ask IRIS
What does MMP’s cash flow statement show for Sep-26?
MMP reported net operating cash flow of Rs 22.8 crore for the period labelled Sep-26, while net investing cash flow was an outflow of Rs 52.9 crore. Financing activities generated Rs 28.7 crore, resulting in a reported Rs 1.4 crore decrease in cash and cash equivalents. The cash flow statement lists opening cash of Rs 2.0 crore and closing cash of Rs 0.6 crore.
The Rs 52.9 crore investing outflow in the Sep-26 period was close to the Rs 54.9 crore outflow reported for FY26 and exceeded the Rs 22.8 crore operating inflow for Sep-26. Financing cash flow changed from an outflow of Rs 7.4 crore in FY26 to an inflow of Rs 28.7 crore at Sep-26. The presentation does not break down investing or financing cash flow by project, borrowing drawdown or repayment.
Why do MMP’s Sep-26 cash figures differ across statements?
MMP’s consolidated balance sheet reports cash and cash equivalents of Rs 5.2 crore at Sep-26, while its consolidated cash flow statement reports Rs 0.6 crore at the end of the same period. The difference is Rs 4.6 crore, and both amounts appear in the presentation’s Sep-26 columns.
The presentation does not provide a reconciliation for the Rs 4.6 crore difference. At Mar-26, both statements reported Rs 2.0 crore, making the difference specific to the Sep-26 presentation. Within the cash flow statement, the reported opening cash of Rs 2.0 crore and net decrease of Rs 1.4 crore reconcile to closing cash of Rs 0.6 crore.
Conclusion
MMP’s Sep-26 balance sheet expansion combined higher shareholders’ funds with higher liabilities. Total assets reached Rs 734.6 crore, supported by increases in non-current investment, inventories and trade receivables. Long-term and short-term borrowings totalled Rs 236.1 crore, while financing cash flow turned into a Rs 28.7 crore inflow during the period labelled Sep-26.
The disclosed unresolved matter is the difference between Rs 5.2 crore of cash and cash equivalents in the Sep-26 balance sheet and Rs 0.6 crore in the cash flow statement. Readers can watch whether a subsequent company disclosure reconciles those figures and provides further detail on the Rs 52.9 crore investing outflow and Rs 55.6 crore CWIP balance.