










Monte Carlo: H1 gross sales rose 13.8%, reported revenue 6.3%
Key highlights
- Monte Carlo’s H1 FY27 gross sales rose 13.8% to Rs 629.8 crore.
- Monte Carlo’s H1 FY27 gross-to-net gap widened to Rs 218.9 crore from Rs 166.9 crore.
- Monte Carlo’s H1 FY27 rebates increased to Rs 54.2 crore from Rs 35.0 crore.
- Monte Carlo’s Q2 FY27 returns fell to 16% of gross sales from 54% in Q1 FY27.
powered by IRIS
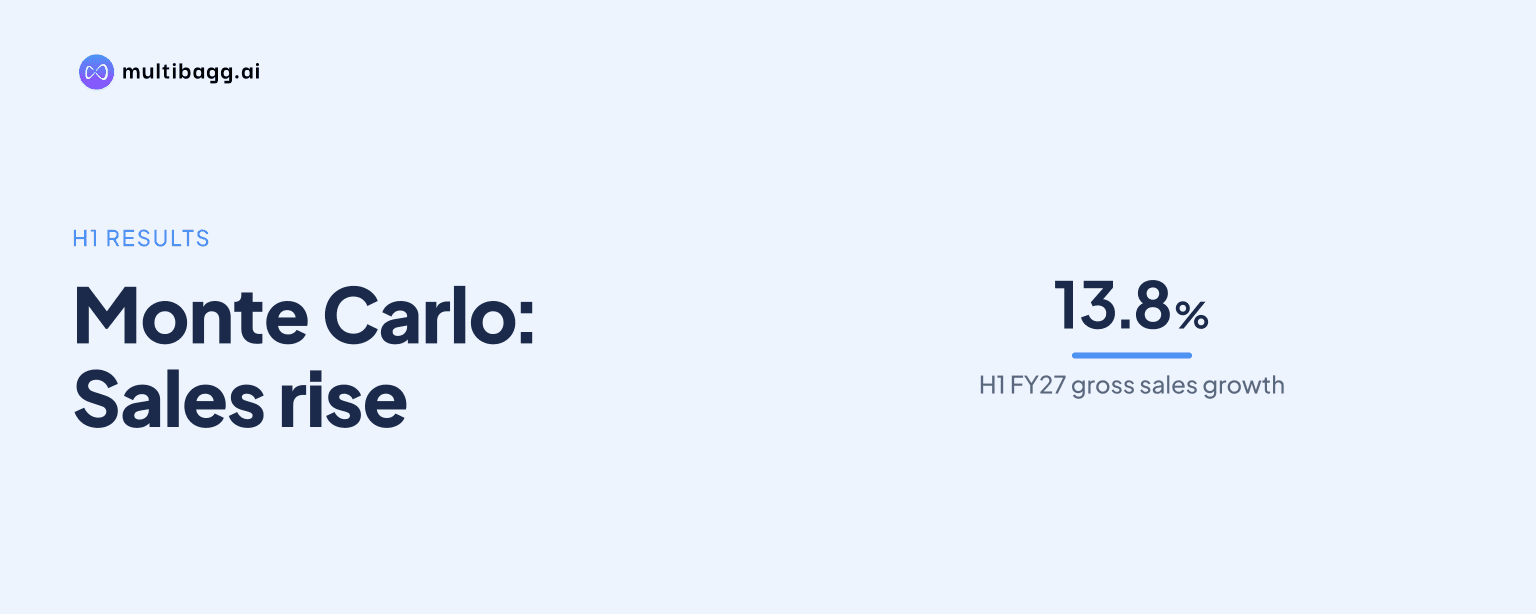
Monte Carlo’s H1 FY27 gross sales rose 13.8% to Rs 629.8 crore, while reported revenue increased 6.3% to Rs 411.4 crore, as the gross-to-net sales gap widened to Rs 218.9 crore from Rs 166.9 crore a year earlier. Higher returns and rebates reduced conversion of merchandise sales into net sales.
Know Monte Carlo Fashions inside out
Results, valuation, peers and who's buying, in one view.
Why did Monte Carlo’s H1 revenue grow slower than gross sales?
Monte Carlo’s H1 FY27 revenue grew more slowly than gross sales because returns, rebates and net provisions created a larger reduction between gross merchandise sales and net sales. Gross sales in the bridge rose from Rs 553.7 crore in H1 FY26 to Rs 629.8 crore in H1 FY27, but bridge net sales increased from Rs 386.8 crore to Rs 410.9 crore.
The difference between bridge gross sales and net sales expanded by Rs 52.0 crore to Rs 218.9 crore in H1 FY27. Monte Carlo separately reported revenue of Rs 411.4 crore for H1 FY27, compared with Rs 387.2 crore in H1 FY26. The presentation labels the Rs 410.9 crore measure as net sales in a gross merchandise sales bridge, so it is close to, but not identical with, reported revenue.
The Rs 76.1 crore increase in gross sales yielded a Rs 24.1 crore increase in bridge net sales. Higher returns absorbed Rs 30.6 crore of the year-on-year gross-sales increase, while rebates absorbed a further Rs 19.2 crore. Net provisions remained a positive contribution in both half years, but fell by Rs 2.3 crore. The individual H1 FY27 bridge lines calculate to Rs 410.8 crore, Rs 0.1 crore below the stated Rs 410.9 crore net-sales figure.
How did returns, rebates and provisions change in H1 FY27?
Monte Carlo’s H1 FY27 returns increased to Rs 193.8 crore from Rs 163.2 crore, while rebates rose to Rs 54.2 crore from Rs 35.0 crore. Returns were the largest gross-to-net adjustment in both half years and represented most of the Rs 218.9 crore H1 FY27 gap between bridge gross sales and net sales.
Management said Q2 FY27 returns were lower and neutralised the higher returns recorded in Q1 FY27, leaving H1 FY27 returns similar on a year-on-year basis. The bridge nevertheless shows a higher absolute return value because H1 FY27 gross sales were Rs 76.1 crore above the prior-year period. The presentation does not disclose the underlying commercial terms or customer behaviour behind the Rs 19.2 crore increase in rebates.
Net provisions were positive Rs 29.0 crore in H1 FY27, compared with positive Rs 31.3 crore in H1 FY26. Therefore, net provisions did not operate as a half-year deduction in the bridge, but their smaller positive contribution reduced net sales relative to the prior year. Monte Carlo does not provide the components of the net-provisions line.
Got a follow-up? Ask IRIS
Did lower Q2 returns offset Monte Carlo’s Q1 return spike?
Monte Carlo said lower Q2 FY27 returns neutralised the Q1 FY27 return effect, after the quarterly return rate fell to 16% of gross sales from 54% in Q1 FY27. In the comparable FY26 periods, returns were 41% of gross sales in Q1 and 23% in Q2. Management had previously said retailer returns were processed early in Q1 and that the effect should reverse over the next two quarters.
Q2 FY27 returns fell to Rs 62.0 crore from Rs 82.7 crore in Q2 FY26, even as gross sales rose to Rs 383.6 crore from Rs 356.7 crore. However, the lower return value did not narrow the quarterly gross-to-net gap because rebates increased to Rs 38.9 crore from Rs 21.3 crore and net provisions moved to negative Rs 20.5 crore from negative Rs 4.2 crore.
The Q2 FY27 gap between gross sales and net sales was Rs 121.4 crore, compared with Rs 108.2 crore in Q2 FY26. Bridge net sales rose to Rs 262.2 crore from Rs 248.5 crore, while reported Q2 revenue was Rs 262.4 crore, up 5.5% year on year. Operating earnings before interest, tax, depreciation and amortisation, or EBITDA, fell to Rs 28.4 crore from Rs 41.5 crore, and the operating EBITDA margin declined to 10.8% from 16.7%.
Which products and channels generated H1 FY27 gross-sales growth?
Cotton generated the largest product-category increase for Monte Carlo in H1 FY27, rising 21.8% to Rs 397.95 crore and increasing its gross-sales share to 63.4% from 59.2%. Cotton was also the largest category in Q2 FY27, accounting for 58.1% of gross sales, compared with 52.9% in Q2 FY26.
Home textiles increased to Rs 91.64 crore in H1 FY27 from Rs 83.00 crore, while kids sales rose to Rs 34.46 crore from Rs 30.62 crore. Footwear increased 91.6% to Rs 9.31 crore from Rs 4.86 crore, but accounted for 1.5% of H1 category gross sales. Woollen sales declined to Rs 94.04 crore from Rs 106.24 crore; Monte Carlo said woollen sales would pick up from Q3 FY27.
Exclusive brand outlets, or EBOs, represented 39.4% of H1 FY27 sales, versus 39.9% in H1 FY26. National chain stores increased their share to 11.3% from 7.3%, and online sales rose to 12.2% from 11.9%. At 30 September 2026, Monte Carlo had 506 EBOs, 846 national chain stores and 632 shop-in-shops, compared with 475, 778 and 536 respectively a year earlier.
Conclusion
Monte Carlo’s H1 FY27 gross-sales growth did not convert proportionately into reported revenue growth. Gross sales increased by Rs 76.1 crore in the bridge, but bridge net sales rose by Rs 24.1 crore, as returns increased by Rs 30.6 crore, rebates increased by Rs 19.2 crore and the positive net-provisions contribution declined by Rs 2.3 crore. Cotton supplied the largest category growth, while woollen sales fell in the first half.
The next disclosed test is Q3 FY27, when Monte Carlo expects woollen sales to pick up and plans to begin Big Basket sales after signing agreements. Management has said low-double-digit FY27 revenue growth remains on track, supported by a seasonally stronger second half. Q3 contributed 47% of FY26 revenue, so the gross-to-net bridge, rebates and return pattern during that quarter will be central to tracking delivery against that view.