










Monte Carlo sales mix shifts as MBO/SIS share declines in Q2
Key highlights
- Monte Carlo's MBO/SIS sales share fell to 17.4% in Q2 FY27 from 24.7% in Q2 FY26.
- Monte Carlo's NCS and online channels represented a combined 26.9% of Q2 FY27 sales, up from 20.3% a year earlier.
- Monte Carlo operated 506 EBOs at 30 September 2026, compared with 475 at 30 September 2025.
- Monte Carlo reported 24 EBO openings and 15 closures in H1 FY27.
powered by IRIS
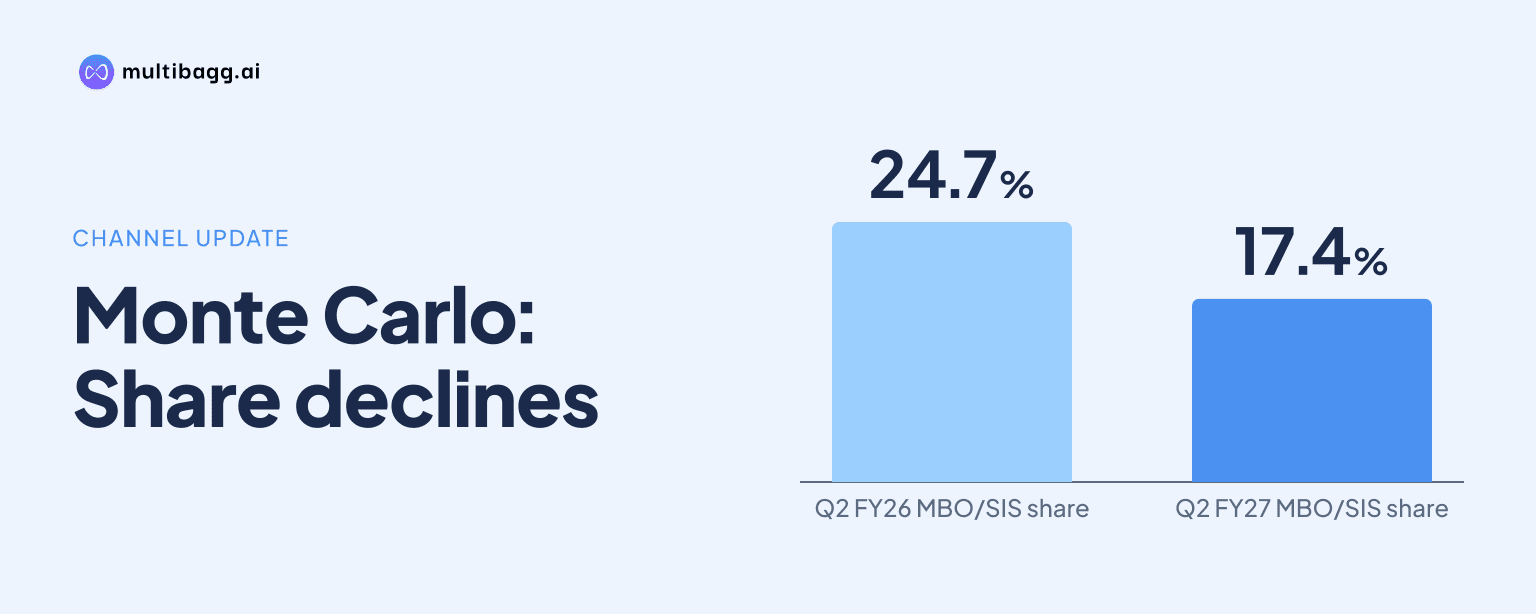
Monte Carlo reduced MBO/SIS to 17.4% of sales in Q2 FY27 from 24.7% a year earlier, while national chain stores and online together accounted for 26.9%. EBOs remained the largest individual channel at 39.4%, and the company’s EBO network reached 506 outlets at 30 September 2026, up from 475 a year earlier.
Know Monte Carlo Fashions inside out
Results, valuation, peers and who's buying, in one view.
How did Monte Carlo's sales-channel mix change in Q2 FY27?
Monte Carlo's Q2 FY27 sales mix shifted most visibly away from MBO/SIS, or multi-brand outlets and shop-in-shops, whose contribution fell 7.3 percentage points year on year to 17.4%. The channel had represented 24.7% of Q2 FY26 sales and 32.6% of Q2 FY25 sales, while EBOs, or exclusive brand outlets, remained the largest route at 39.4%, compared with 40.2% and 34.3%, respectively.
National chain stores, or NCS, contributed 13.4% of Q2 FY27 sales, rising from 8.2% in Q2 FY26. Online sales reached 13.5%, versus 12.1%, taking the combined NCS and online share to 26.9% from 20.3% a year earlier. Textile contributed 11.1%, up from 10.4%, while Corporate contributed 5.2%, compared with 4.4%.
The comparison shows that the decline in MBO/SIS was not matched by a comparable fall in EBO sales share. EBO share was down 0.8 percentage points from Q2 FY26, whereas NCS gained 5.2 percentage points and online gained 1.4 percentage points. Monte Carlo's Q2 data therefore records a larger role for national chains and online alongside a broadly stable EBO share.
What does Monte Carlo's H1 FY27 channel mix show?
Monte Carlo's H1 FY27 channel mix shows the same direction as the quarterly data, although the MBO/SIS change was smaller. MBO/SIS represented 19.4% of H1 FY27 sales, compared with 24.6% in H1 FY26 and 30.1% in H1 FY25. EBOs accounted for 39.4%, versus 39.9% a year earlier, retaining their position as the largest individual sales channel.
NCS rose to 11.3% of H1 FY27 sales from 7.3% in H1 FY26, an increase of 4.0 percentage points. Online contributed 12.2%, compared with 11.9%, while Textile increased to 12.7% from 12.2% and Corporate rose to 5.0% from 4.1%. NCS and online combined represented 23.5% of H1 FY27 sales, up from 19.2% in H1 FY26.
The channel changes coincided with H1 FY27 gross sales growth of 13.8% to Rs 627.4 crore. Cotton sales increased 21.8% and accounted for 63.4% of gross sales, compared with 59.2% in H1 FY26. Woollen's share fell to 15.0% from 19.3%, while footwear sales grew 91.6% from a small base and represented 1.5% of H1 gross sales.
How large was Monte Carlo's store network at September 2026?
Monte Carlo operated 506 EBOs at 30 September 2026, 31 more than the 475 reported at 30 September 2025 and nine above the FY26 closing count of 497. The network had grown from 278 EBOs in FY20 to 356 in FY23, 406 in FY24 and 471 in FY25, before reaching 497 in FY26.
The MBO count declined to 1,413 at 30 September 2026 from 1,511 a year earlier. In contrast, NCS increased to 846 from 778 and SIS increased to 632 from 536. Monte Carlo says its MBO count includes distributors and is based on actual dispatch during the year, which qualifies comparisons of the 98-outlet reduction.
Monte Carlo also reported 27 Cloak & Decker EBOs at September 2026, up from 25 at June 2026 and 17 at 30 September 2025. Rock.it outlets reached eight, compared with six in June 2026 and two a year earlier. These branded-format counts rose during the period in which the total EBO base increased to 506.
Got a follow-up? Ask IRIS
What is Monte Carlo's EBO expansion plan for FY27?
Management's FY27 plan is to open 40 to 45 new EBOs, with West and South identified as the focus regions. By H1 FY27, Monte Carlo reported 24 openings and 15 closures. The difference between the FY26 closing base of 497 and the 506 outlets reported at September 2026 was nine stores.
Monte Carlo identified compact formats of 500 to 1,000 square feet in West and South as part of its store approach. West had 30 EBOs and South had 26 at both June 2026 and September 2026. The presentation says closures and sales per store help assess returns from expansion, rather than presenting openings alone as the measure of network progress.
The FY26 store-performance data provides the disclosed comparison for this strategy. Weighted average gross revenue per EBO rose 13.6% to Rs 1.42 crore in FY26 from Rs 1.25 crore in FY25, returning to the Rs 1.42 crore recorded in FY24. The EBO network increased to 497 in FY26 from 471 in FY25 and 406 in FY24.
How did Monte Carlo's online and quick-commerce availability develop?
Monte Carlo's online sales share increased to 13.5% in Q2 FY27 from 12.1% in Q2 FY26, while the regional-sales table reported online mix of 13.48% and year-on-year online growth of 17.88%. In H1 FY27, online represented 12.2% of sales, compared with 11.9% in H1 FY26.
Monte Carlo said it was live on Blinkit, Swiggy and Zepto in its Q1 FY27 commentary. In its Q2 FY27 update, the company said it had signed agreements with Big Basket and that sales would commence in Q3 FY27. The presentation does not disclose Big Basket sales in Q2 FY27.
The channel mix should be read alongside the gross-to-net sales bridge. Q2 FY27 gross sales were Rs 383.6 crore and net sales were Rs 262.2 crore, after Rs 62 crore of returns, Rs 38.9 crore of rebates and Rs 20.5 crore of net provisions. Returns were 16% of gross sales in Q2 FY27, down from 54% in Q1 FY27, and management said lower Q2 returns neutralised the higher Q1 returns on an H1 year-on-year basis.
Conclusion
Monte Carlo's Q2 FY27 figures show lower dependence on MBO/SIS, with that channel's share falling to 17.4% as NCS and online reached a combined 26.9%. EBOs remained the largest individual channel at 39.4%, while the network expanded to 506 outlets and NCS and SIS outlet counts increased year on year.
The next measures to watch are management's FY27 plan for 40 to 45 new EBOs, its West and South store focus, and the scheduled Q3 FY27 commencement of Big Basket sales. Q3 accounted for 47% of FY26 revenue, so the seasonally important quarter will also be relevant to management's stated low-double-digit FY27 revenue-growth outlook.