










Oswal Pumps H1 margin falls to 13.4% as leverage increases
Key highlights
- Oswal Pumps reported a 13.4% operating EBITDA margin in H1 FY27, versus 24.9% in FY26.
- H1 FY27 revenue from operations was Rs 979.9 crore and PAT was Rs 93.5 crore.
- Annualized net debt to operating EBITDA rose to 2.02 times in H1 FY27 from 0.26 times in FY26.
- Oswal Pumps disclosed a 143 MW order book and a 168 MW solar-project pipeline.
powered by IRIS
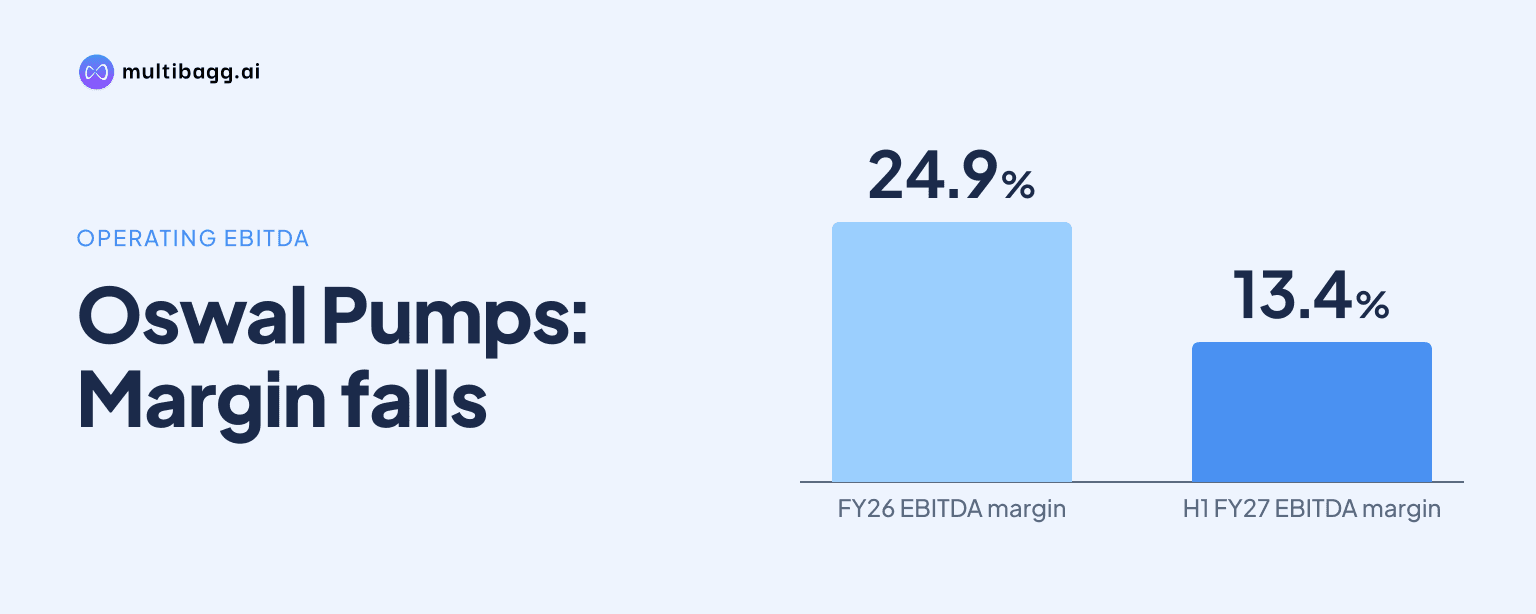
Oswal Pumps & Motors, referred to here as Oswal Pumps, recorded a 13.4% operating EBITDA margin in H1 FY27, down from 24.9% in FY26, as annualized net debt to operating EBITDA increased to 2.02 times from 0.26 times. H1 FY27 operating EBITDA was Rs 131.7 crore on revenue from operations of Rs 979.9 crore.
Know Oswal Pumps inside out
Results, valuation, peers and who's buying, in one view.
Why did Oswal Pumps' H1 FY27 operating margin decline?
Oswal Pumps' H1 FY27 margin decline was accompanied by lower gross and operating profit margins than in FY26. Gross margin fell 7.4 percentage points to 31.9% from 39.3%, while operating EBITDA margin declined 11.5 percentage points to 13.4% from 24.9%.
Operating EBITDA was Rs 131.7 crore in H1 FY27, compared with Rs 513.9 crore for the full FY26. The presentation defines operating EBITDA as profit before exceptional item and tax, plus finance cost and depreciation and amortisation, less other income.
The H1 FY27 margin was also below the full-year levels reported from FY23 through FY26. Operating EBITDA rose from Rs 57.8 crore in FY23 to Rs 150.1 crore in FY24, Rs 419.9 crore in FY25 and Rs 513.9 crore in FY26, while margins were 15.0%, 19.8%, 29.4% and 24.9%, respectively.
How did Oswal Pumps' revenue and profit change?
Oswal Pumps reported Rs 979.9 crore of revenue from operations and Rs 93.5 crore of profit after tax, or PAT, in H1 FY27. PAT margin was 9.4% in the half year, compared with 18.0% for FY26.
Revenue from operations increased from Rs 385 crore in FY23 to Rs 758.6 crore in FY24, Rs 1,430.3 crore in FY25 and Rs 2,064.4 crore in FY26. The presentation displays 75.0% with the revenue series, while FY26 revenue was Rs 634.1 crore higher than FY25 revenue; H1 FY27 is a half-year figure rather than a full fiscal year.
PAT increased from Rs 34.2 crore in FY23 to Rs 97.7 crore in FY24, Rs 280.6 crore in FY25 and Rs 376.3 crore in FY26. PAT margin rose from 8.8% in FY23 to 19.6% in FY25 before reducing to 18.0% in FY26 and 9.4% in H1 FY27.
Gross profit was Rs 118.2 crore in FY23, Rs 255.6 crore in FY24, Rs 631.4 crore in FY25 and Rs 811.6 crore in FY26, before reaching Rs 312.2 crore in H1 FY27. Gross margin peaked at 44.1% in FY25, then declined to 39.3% in FY26 and 31.9% in H1 FY27.
Got a follow-up? Ask IRIS
What changed in Oswal Pumps' returns and leverage?
Oswal Pumps reported annualized H1 FY27 return on net worth, or RoNW, of 10.9% and return on capital employed, or RoCE, of 13.0%, compared with 35.7% and 37.4% in FY26. The presentation calculates RoCE and return on equity using the average of the current and previous fiscal.
RoNW was 80.9% in FY23, 88.7% in FY24 and 93.0% in FY25 before declining to 35.7% in FY26. RoCE was 44.4% in FY23, 57.7% in FY24, 64.6% in FY25 and 37.4% in FY26; the H1 FY27 return figures are annualized and are therefore not the same reporting period as the full-year figures.
Net debt to equity rose to 0.30 times in H1 FY27 from 0.08 times in FY26, after readings of 0.78 times in FY23, 1.21 times in FY24 and 0.99 times in FY25. Annualized net debt to operating EBITDA increased to 2.02 times from 0.26 times in FY26, versus 1.06 times in FY23, 1.45 times in FY24 and 1.09 times in FY25.
The presentation states that suppliers' credit was reclassified from other current financial liabilities to current borrowings following amendments to Indian Accounting Standards, or Ind AS, 107 and 101. This stated classification change is relevant when reading the debt ratios across periods.
What operating indicators and solar plans should readers monitor?
Oswal Pumps reported annualized H1 FY27 capacity utilisation of 89.2% for stainless steel pumps, 75.6% for cast iron pumps, 68.3% for stainless steel motors and 68.8% for cast iron motors. Solar-module utilisation was 77.3%, up from 71.4% in FY26, with installed module capacity unchanged at 570 megawatts, or MW.
Stainless steel pump capacity remained 1,160.07 metric tonnes from FY24 through H1 FY27, while utilisation rose from 57.1% in FY24 to 95.1% in FY26 before easing to 89.2% in H1 FY27. Cast iron pump capacity increased from 2,123.04 metric tonnes in FY24 to 3,544.13 metric tonnes in FY25 and remained at that level through H1 FY27.
Oswal Pumps disclosed a 143 MW current order book, a 168 MW pipeline, participation in 200 MW of tenders and 1,029 MW of open and upcoming tenders. Oswal Solar Energy Private Limited holds a 60% stake in Oswal Doon Baran Bundi Solar Projects Limited, established with Doon Infrapower Projects Private Limited for rooftop photovoltaic projects on Rajasthan state government buildings under the Hybrid Annuity Mode.
Conclusion
Oswal Pumps' H1 FY27 data show reduced reported profitability and returns alongside higher leverage. Operating EBITDA margin declined to 13.4% from 24.9% in FY26, PAT margin fell to 9.4% from 18.0%, and annualized net debt to operating EBITDA rose to 2.02 times from 0.26 times, although revenue and PAT remain above FY23 levels.
The next disclosed operating measures to watch are utilisation at the 570 MW solar-module facility, which was 77.3% annualized in H1 FY27, and conversion of the 143 MW order book and 168 MW pipeline. Oswal Pumps has also stated that its growth plan includes diversification beyond solar irrigation into rooftop, utility and commercial and industrial solar projects.