










Phoenix Mall of Asia hits 99% leased occupancy in Sep-26
Key highlights
- Phoenix Mall of Asia reported 99% leased occupancy for the period ended September 2026 and 96% trading occupancy in Q2 FY27.
- The mall’s upper-ground level averaged more than Rs 250 pspm in Q2 FY27, compared with a Rs 206 pspm mall-wide average.
- Most watch-brand deals were signed at more than Rs 550 pspm, although the number of deals and leased area were not disclosed.
- Lease expiries cover 72% of the portfolio’s operational retail GLA between FY26 and FY30, including 24% or approximately 2.74 million square feet in FY28.
powered by IRIS
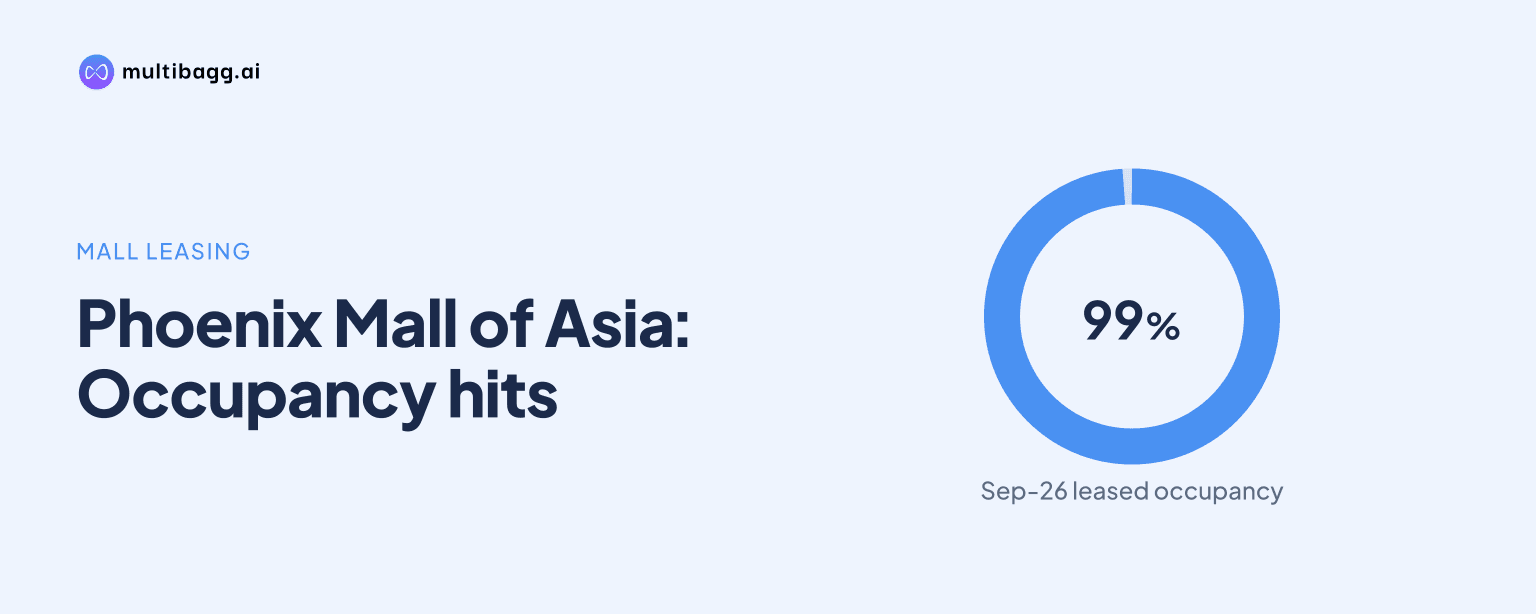
Phoenix Mall of Asia reported 99% leased occupancy for the period ended September 2026 and 96% trading occupancy in Q2 FY27. Its prime upper-ground level averaged more than Rs 250 pspm, against a Rs 206 pspm mall average, as management placed selected star and luxury brands in that location.
Know Phoenix Mills inside out
Results, valuation, peers and who's buying, in one view.
What occupancy had Phoenix Mall of Asia reached?
Phoenix Mall of Asia reached 99% leased occupancy for the period ended September 2026, while trading occupancy was 96% in Q2 FY27. The 3-percentage-point difference shows that leased space exceeded space trading at that point. The presentation does not identify the tenants yet to open, their store areas or their expected opening dates.
The reported 96% trading occupancy was also above the approximately 95% level that the presentation identifies as a portfolio ramp-up point as stores open. This comparison is directional rather than a like-for-like historical measure because the approximately 95% reference is a portfolio objective, while 96% is Phoenix Mall of Asia's Q2 FY27 reported level. No prior-quarter occupancy figure is given for the mall.
How are premium leases affecting Phoenix Mall of Asia rentals?
Phoenix Mall of Asia is using selective leasing of its prime upper-ground level to support higher rentals. Management says this space was strategically leased last to select star and luxury brands, linking the approach to higher trading density and the mall's highest rental per square foot.
The upper-ground level averaged more than Rs 250 pspm in Q2 FY27, compared with a Rs 206 pspm mall-wide average. The presentation uses pspm for its rental-rate measure but does not define the abbreviation. Based on the stated minimum upper-ground threshold, that floor's average was more than Rs 44 pspm above the mall average.
Phoenix Mall of Asia also disclosed that most watch-brand deals were signed at more than Rs 550 pspm. That threshold is more than twice the upper-ground average threshold and more than 2.6 times the Rs 206 pspm mall average. However, the presentation does not disclose the number of watch-brand deals, the area leased, lease tenures or their contribution to total mall rent.
The supplied disclosure does not report a 45% rental-income increase for Phoenix Mall of Asia. It provides the September 2026 occupancy levels and Q2 FY27 rental benchmarks, but no H1 rental income, prior-H1 rental income, earnings before interest, tax, depreciation and amortisation, or rental-income growth percentage for the mall.
Got a follow-up? Ask IRIS
How does Phoenix Mall of Asia fit the wider leasing plan?
Phoenix Mall of Asia's luxury-brand placement forms part of a wider retail plan based on repositioning, lease expiries and premium-format additions. The presentation says rental uplift can come from rechurned space, while contractual expiries can enable repricing without new capital expenditure. It also says luxury brands and flagship formats are being added across the portfolio.
The portfolio has lease expiries covering 72% of operational retail gross leasable area, or GLA, between FY26 and FY30. The largest annual portion is 24% in FY28, equal to approximately 2.74 million square feet, while total expiries across the five financial years are approximately 8.21 million square feet. Management says this creates opportunities to refresh brand and category mixes and seek higher re-leasing spreads without new capital expenditure.
A separate Phoenix MarketCity Bangalore case study illustrates the portfolio's re-layout mechanism but is not a Phoenix Mall of Asia forecast. Its gross leasable area rose from 0.82 lakh square feet to 0.87 lakh square feet after a hypermarket and one fashion anchor were replaced by one electronics and two fashion anchors. Projected stabilised trading density rose from Rs 568 pspm to Rs 2,932 pspm, while monthly rent rose from Rs 65 lakh to Rs 1.23 crore.
What should readers watch at Phoenix Mall of Asia next?
Readers should watch whether Phoenix Mall of Asia converts the remaining gap between 99% leased occupancy and 96% trading occupancy into additional operating stores. The presentation frames store openings as the mechanism through which trading occupancy rises, but it gives no timetable for the 3 percentage points of leased space not trading in Q2 FY27.
The next relevant rental measure is any change in the Rs 206 pspm mall-wide average reported in Q2 FY27. The upper-ground average already exceeded Rs 250 pspm and watch-brand deals exceeded Rs 550 pspm, but the source does not set a future mall-rental target or disclose the weighted average rent and area of these premium leases.
Conclusion
Phoenix Mall of Asia's reported ramp-up combines 99% leased occupancy at September 2026 with 96% trading occupancy in Q2 FY27 and a premium leasing strategy. The disclosed rental hierarchy is clear: more than Rs 550 pspm for most watch-brand deals, more than Rs 250 pspm on the upper-ground level, and Rs 206 pspm across the mall. The source supports a finding on occupancy and rental positioning, not a reported 45% increase in rental income.
The immediate unresolved matter is the opening and rental contribution of space that was leased but not trading in Q2 FY27. Management's broader FY26-to-FY30 plan identifies 72% of operational retail GLA for lease expiry and potential re-leasing, but it provides no Phoenix Mall of Asia rental-income target, H1 income comparison or timetable for further luxury-store openings.