










Phoenix Mills hotels: St. Regis grows as Agra EBITDA falls
Key highlights
- Phoenix Mills’ hotels income rose 15% year on year to Rs 282 crore in H1 FY27, while hotels EBITDA increased 16% to Rs 118 crore.
- The St. Regis, Mumbai, grew H1 FY27 revenue 16% to Rs 261 crore and EBITDA 17% to about Rs 116 crore, with a 45% EBITDA margin.
- The St. Regis recorded 82% H1 FY27 occupancy, a Rs 21,051 average room rate and Rs 17,353 RevPAR.
- CYMA’s H1 FY27 revenue increased 7% to Rs 21 crore, but EBITDA fell 24% to about Rs 1.5 crore despite 76% occupancy and 31% RevPAR growth.
powered by IRIS
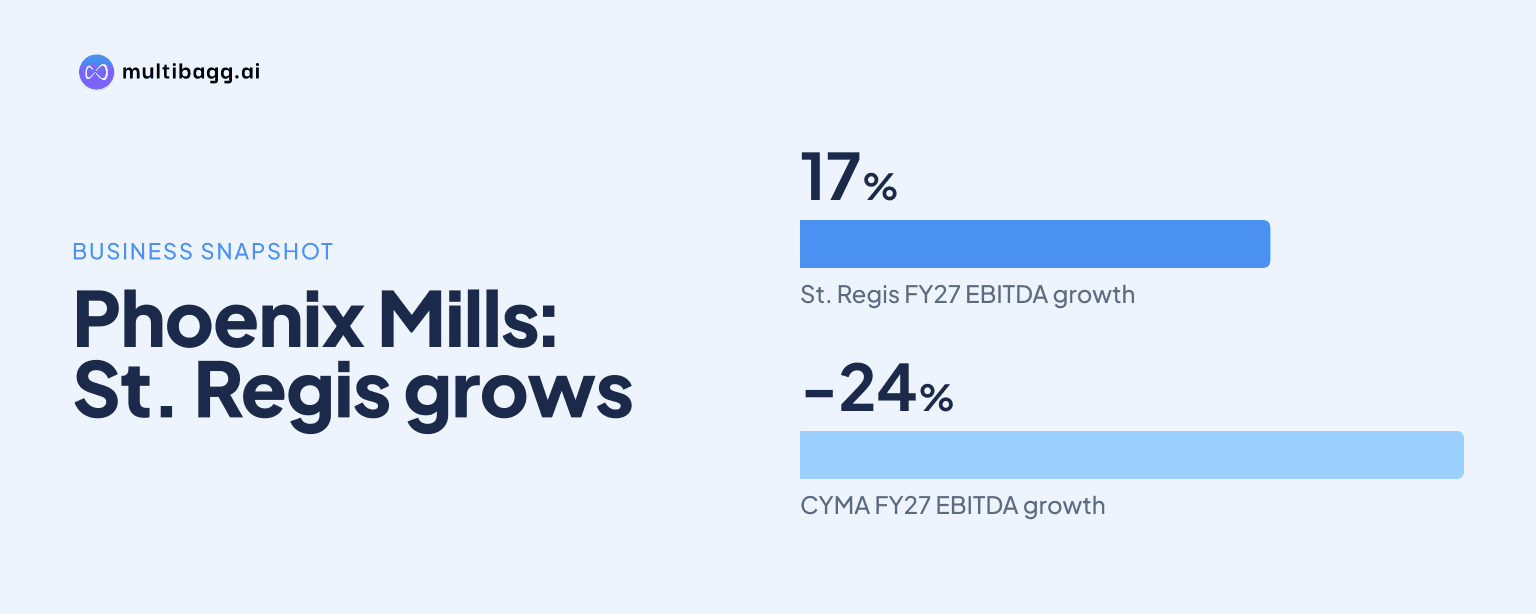
Phoenix Mills’ H1 FY27 hotel results split sharply: The St. Regis, Mumbai raised revenue 16% to Rs 261 crore and EBITDA 17% to about Rs 116 crore, while Courtyard by Marriott, Agra, or CYMA, reported 7% revenue growth to Rs 21 crore but a 24% EBITDA decline to about Rs 1.5 crore.
Know Phoenix Mills inside out
Results, valuation, peers and who's buying, in one view.
How did Phoenix Mills’ hotel portfolio perform in H1 FY27?
Phoenix Mills’ hotels portfolio increased H1 FY27 income by 15% year on year to Rs 282 crore, while earnings before interest, tax, depreciation and amortisation, or EBITDA, rose 16% to Rs 118 crore. In Q2 FY27, income rose 13% from Q2 FY26 to Rs 137 crore and EBITDA increased 12% to Rs 56 crore.
The portfolio’s H1 figures were principally generated by The St. Regis. The St. Regis reported Rs 261 crore of H1 FY27 revenue and about Rs 116 crore of EBITDA, while CYMA reported Rs 21 crore of revenue and about Rs 1.5 crore of EBITDA. The two properties’ revenue totals equal the Rs 282 crore hotels income reported by Phoenix Mills.
What drove The St. Regis’ H1 FY27 growth?
The St. Regis increased H1 FY27 revenue by 16% to Rs 261 crore and EBITDA by 17% to about Rs 116 crore, with a reported EBITDA margin of 45%. Average room rate, or ARR, increased 16% to Rs 21,051 from Rs 18,129 in H1 FY26, while revenue per available room, or RevPAR, rose 14% to Rs 17,353 from Rs 15,230.
Occupancy at The St. Regis was 82% in H1 FY27. Food and beverage, including banquet revenue, contributed 51% of H1 revenue, compared with 46% from rooms and 3% from other sources. In Q2 FY27, food and beverage was also the largest revenue category at 50% of Rs 128 crore, while rooms accounted for 46%.
The Q2 FY27 operating data show higher room pricing alongside revenue growth. ARR increased 20% year on year to Rs 21,247, RevPAR rose 13% to Rs 16,953 and occupancy was 80%. The St. Regis reported about Rs 56 crore of Q2 EBITDA, up 13% year on year, with a 44% margin, compared with its 45% H1 FY27 margin.
Why did CYMA EBITDA fall despite RevPAR growth?
CYMA’s EBITDA fell despite improved room indicators, and Phoenix Mills does not disclose a cost-level explanation for that outcome. H1 FY27 EBITDA was about Rs 1.5 crore, down 24% year on year, and the EBITDA margin was 7%. This followed a 7% increase in revenue to Rs 21 crore.
ARR at CYMA increased 13% to Rs 4,949 in H1 FY27 from Rs 4,384 in H1 FY26, while RevPAR increased 31% to Rs 3,738 from Rs 2,862. H1 occupancy reached 76%, an increase of 10 percentage points from the prior-year period. The larger RevPAR increase than ARR is consistent with the disclosed rise in occupancy.
The Q2 FY27 outcome followed the same pattern. CYMA reported Rs 10 crore of revenue, up 9% year on year, as ARR rose 13% to Rs 4,950 and RevPAR climbed 35% to Rs 3,548. Yet Q2 EBITDA was about Rs 20 lakh, down 37% year on year, and the EBITDA margin was 3%.
Got a follow-up? Ask IRIS
How did The St. Regis and CYMA compare in H1 FY27?
The St. Regis operated at a larger revenue and EBITDA scale than CYMA in H1 FY27. The St. Regis generated Rs 261 crore of revenue and about Rs 116 crore of EBITDA, compared with Rs 21 crore and about Rs 1.5 crore, respectively, at CYMA. Their reported H1 EBITDA margins were 45% and 7%, a difference of 38 percentage points.
The properties also had contrasting revenue mixes. Rooms represented 55% of CYMA’s H1 FY27 revenue, food and beverage represented 42%, and other income 3%. At The St. Regis, rooms accounted for 46%, food and beverage for 51% and other income for 3%, giving it a nine-percentage-point lower rooms share than CYMA.
Room prices remained higher at The St. Regis, although CYMA recorded faster RevPAR growth. The St. Regis’ H1 FY27 ARR was Rs 21,051 and RevPAR was Rs 17,353, compared with Rs 4,949 and Rs 3,738 at CYMA. CYMA’s 31% RevPAR growth exceeded The St. Regis’ 14%, but their EBITDA changes moved in opposite directions: down 24% at CYMA and up 17% at The St. Regis.
Does Phoenix Mills’ presentation show a widening hotel margin gap?
Phoenix Mills’ presentation establishes a substantial current-period margin difference, but it does not provide enough prior-year margin data to calculate whether the gap widened over time. In H1 FY27, The St. Regis reported a 45% EBITDA margin and CYMA reported 7%. In Q2 FY27, the respective margins were 44% and 3%.
The year-on-year EBITDA trends nonetheless diverged in both reported periods. The St. Regis’ EBITDA rose 13% in Q2 FY27 and 17% in H1 FY27, while CYMA’s EBITDA declined 37% and 24%, respectively. Phoenix Mills does not provide Q2 FY26 or H1 FY26 property-level EBITDA margins, nor does it identify the expense categories behind CYMA’s decline.
Conclusion
Phoenix Mills’ H1 FY27 hotel growth was led by The St. Regis, where higher ARR, higher RevPAR and a food-and-beverage revenue share of 51% accompanied Rs 261 crore of revenue and about Rs 116 crore of EBITDA. CYMA improved its ARR, occupancy and RevPAR, but its EBITDA fell to about Rs 1.5 crore and its margin was 7%.
The next results will show whether The St. Regis can sustain its 82% H1 FY27 occupancy and 45% EBITDA margin, and whether CYMA can convert its 76% occupancy and Rs 3,738 RevPAR into EBITDA growth. Phoenix Mills has not disclosed CYMA’s cost drivers or prior-year property-level margins, leaving both matters unresolved.