










Phoenix Mills Limited generates Rs 1,215 crore H1 free cash flow
Key highlights
- PML generated Rs 1,215 crore of operating free cash flow in H1 FY27, up 22% from Rs 998 crore in H1 FY26.
- Retail, offices and hotels contributed Rs 1,137 crore of H1 FY27 operating free cash flow, up 30% year on year.
- Consolidated EBITDA increased 10% to Rs 1,352 crore in H1 FY27, while income from operations rose 8% to Rs 2,228 crore.
- PML’s gross debt rose Rs 953 crore to Rs 6,117 crore by 30 September 2026, while liquidity increased Rs 634 crore to Rs 2,638 crore.
powered by IRIS
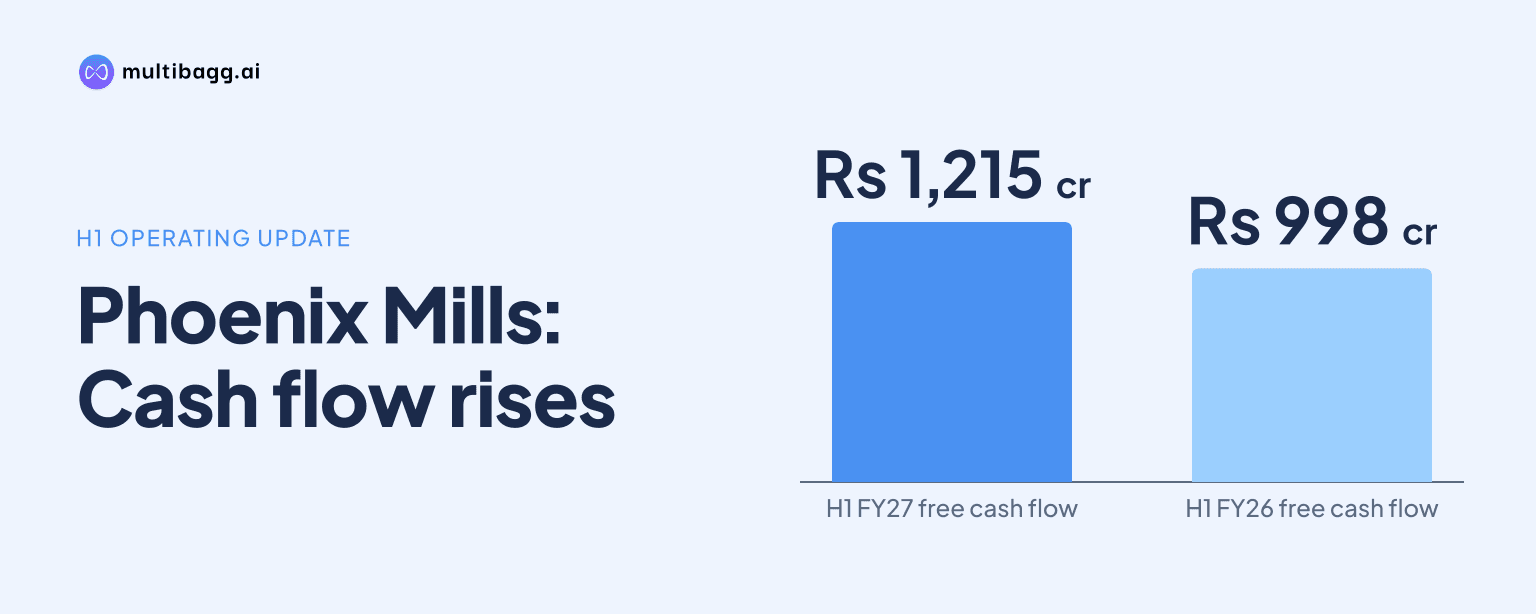
Phoenix Mills Limited generated Rs 1,215 crore of operating free cash flow in H1 FY27, up 22% from Rs 998 crore in H1 FY26. PML’s retail, offices and hotels operations contributed Rs 1,137 crore, while group net debt increased by Rs 319 crore to Rs 3,479 crore as of 30 September 2026. Net debt to EBITDA remained 1.2 times.
Know Phoenix Mills inside out
Results, valuation, peers and who's buying, in one view.
How much operating free cash flow did PML generate in H1 FY27?
PML generated Rs 1,215 crore of operating free cash flow in H1 FY27, compared with Rs 998 crore in H1 FY26. The company defines this measure as net cash flow from operating activities after taxes, adjusted for interest paid or received. Net cash from operating activities increased 19% to Rs 1,367 crore from Rs 1,148 crore.
Net interest paid was Rs 151 crore in H1 FY27, compared with Rs 149 crore in H1 FY26, a 1% increase. In Q2 FY27, operating free cash flow was Rs 631 crore, up 22% from Rs 516 crore in Q2 FY26, while net cash from operating activities rose 20% to Rs 711 crore.
The cash-flow increase accompanied growth in consolidated operating earnings before interest, tax, depreciation and amortisation, or EBITDA. Consolidated EBITDA rose 10% to Rs 1,352 crore in H1 FY27 from Rs 1,231 crore, while income from operations increased 8% to Rs 2,228 crore and EBITDA margin rose by one percentage point to 61%.
Which PML businesses generated H1 FY27 operating free cash flow?
PML’s retail, offices and hotels businesses contributed Rs 1,137 crore of operating free cash flow in H1 FY27, up 30% from Rs 872 crore in H1 FY26. Residential contributed Rs 78 crore, down 38% from Rs 126 crore, making the retail, office and hotel portfolio the principal source of the Rs 217 crore increase in total operating free cash flow.
The same contrast appeared in Q2 FY27. Retail, offices and hotels generated Rs 570 crore of operating free cash flow, 28% above Rs 446 crore in Q2 FY26, whereas residential generated Rs 60 crore, 13% below Rs 69 crore a year earlier.
PML’s annuity businesses, comprising retail, offices, hotel and asset management, reported H1 FY27 revenue of Rs 2,089 crore, up 16% from Rs 1,794 crore. Their EBITDA increased 20% to Rs 1,318 crore, while residential and other EBITDA fell 75% to Rs 34 crore from Rs 136 crore.
The profit comparison also favoured the annuity businesses. Their profit after tax rose 31% to Rs 793 crore in H1 FY27 from Rs 605 crore, while residential and other profit after tax declined 75% to Rs 25 crore from Rs 98 crore.
Got a follow-up? Ask IRIS
Why did PML’s net debt rise in H1 FY27?
PML does not provide a use-of-funds bridge explaining the rise in group net debt during H1 FY27. Group net debt increased by Rs 319 crore to Rs 3,479 crore at 30 September 2026, from Rs 3,160 crore at 31 March 2026.
Gross debt increased by Rs 953 crore to Rs 6,117 crore, while liquidity increased by Rs 634 crore to Rs 2,638 crore. PML defines liquidity as bank balances, investments and debt service reserve account balances, so the liquidity increase offset part, but not all, of the gross-debt increase.
The presentation identifies several projects moving into execution but does not connect them to the debt movement. Excavation had commenced at phase one retail projects in Thane, Coimbatore and Chandigarh, while Bangalore Expansion phase three had secured approvals and had civil contracts awarded.
The group debt figures include associate companies that are outside PML’s consolidated financial statements and exclude amounts available in overdraft accounts. That scope also applies to the net-debt-to-EBITDA calculation, unlike the reported consolidated H1 FY27 EBITDA of Rs 1,352 crore.
Did PML’s leverage and borrowing cost change?
PML reported net debt to EBITDA of 1.2 times at both 30 September 2026 and 31 March 2026. The September ratio uses trailing 12-month EBITDA for H1 FY27, whereas the March ratio uses full-year EBITDA for FY26; both inputs include associate companies.
PML’s average cost of debt was 7.66% in September 2026, compared with 7.69% in June 2026 and 7.51% in March 2026. The Reserve Bank of India, or RBI, repo rate was 5.25% in both June and September 2026, and PML disclosed a September spread of 241 basis points, where one basis point equals one-hundredth of a percentage point.
The September 2026 average borrowing cost was below 8.50% in March 2025 and 8.81% in March 2024, but above 7.30% in March 2022. PML does not disclose how debt mix, refinancing, floating interest rates or the timing of new borrowings affected the movement from 7.51% in March 2026 to 7.66% in September 2026.
Conclusion
PML’s H1 FY27 cash generation rose faster than consolidated EBITDA, with operating free cash flow increasing 22% to Rs 1,215 crore against a 10% increase in EBITDA to Rs 1,352 crore. Retail, offices and hotels supplied Rs 1,137 crore of operating free cash flow, while a Rs 953 crore rise in gross debt and a Rs 634 crore increase in liquidity resulted in net debt rising Rs 319 crore.
The next disclosed milestones are project completions targeted for 2027 and 2028. PML lists Phoenix Grand Victoria in Kolkata, Phoenix MarketCity Bangalore Expansion, Phoenix Palladium Mumbai Expansion, Phoenix Surat, Art Exchange Bengaluru and Grand Hyatt Bangalore for 2027, while Rise Offices Mumbai is listed for 2028; Phoenix Surat is specifically targeted for completion by the end of 2027.