










Phoenix Mills office income rises 55% as new assets ramp
Key highlights
- Phoenix Mills' commercial-office income rose 55% year on year to Rs 163 crore in H1 FY27, while EBITDA increased 47% to Rs 98 crore.
- Offices completed during 2025 generated Rs 44 crore of H1 FY27 income, up from Rs 3 crore a year earlier, and were 77% leased by September 2026.
- Phoenix Mills' total office portfolio was 79% leased in September 2026, with 3.77 million square feet leased out of 4.77 million square feet.
- Operational office assets generated Rs 119 crore of H1 FY27 income, up 17%, while their EBITDA margin improved to 70% from 69%.
powered by IRIS
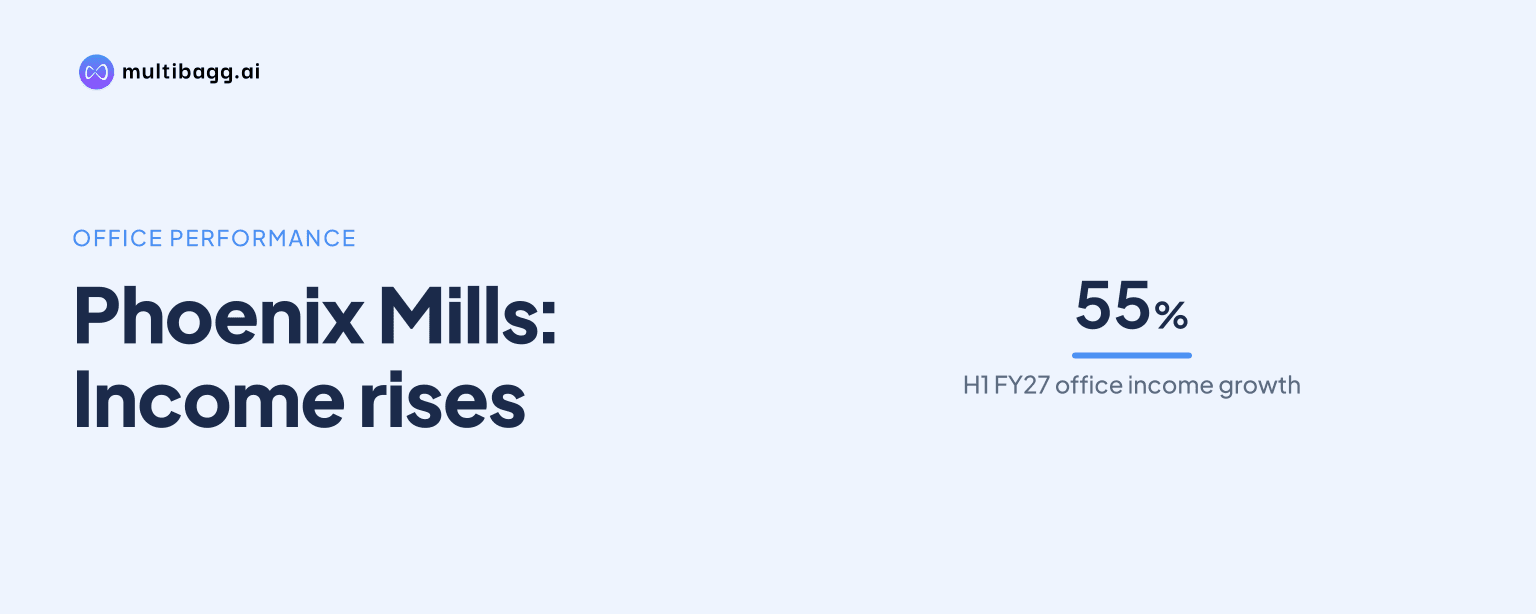
Phoenix Mills reported Rs 163 crore of commercial-office income in H1 FY27, a 55% increase from Rs 105 crore in H1 FY26. The principal addition came from three offices completed during 2025, which generated Rs 44 crore of income and had 77% of their 2.87 million square feet leased by September 2026.
Know Phoenix Mills inside out
Results, valuation, peers and who's buying, in one view.
How much did Phoenix Mills' office income grow in H1 FY27?
Phoenix Mills' commercial-office income grew Rs 58 crore year on year to Rs 163 crore in H1 FY27, while earnings before interest, tax, depreciation and amortisation (EBITDA) rose Rs 31 crore to Rs 98 crore. Income increased 55%, compared with EBITDA growth of 47%, and the reported EBITDA margin was 60%, versus 64% in H1 FY26.
Phoenix Mills' operational assets generated Rs 119 crore of H1 FY27 income, up 17% from Rs 102 crore, while their EBITDA increased 20% to Rs 84 crore. Their EBITDA margin rose to 70% from 69%, in contrast with the four-percentage-point decline in the total portfolio margin after the newer assets were added to reported income.
The same pattern appeared in Q2 FY27. Phoenix Mills reported total office income of Rs 89 crore, up 64% from Rs 54 crore in Q2 FY26, and EBITDA of Rs 56 crore, up 61% from Rs 35 crore; the quarterly EBITDA margin was 63%, compared with 64% a year earlier.
Which 2025-completed offices are driving Phoenix Mills' income?
Phoenix Asia Towers in Bengaluru, One National Park in Chennai and Millennium Towers in Pune generated combined H1 FY27 income of Rs 44 crore, compared with Rs 3 crore in H1 FY26. Their contribution increased by Rs 41 crore as tenant move-ins and occupancy ramp-up progressed, according to Phoenix Mills.
Millennium Towers was the largest contributor among the three at Rs 19 crore of H1 FY27 income and Rs 5 crore of EBITDA. One National Park generated Rs 15 crore of income and Rs 10 crore of EBITDA, while Phoenix Asia Towers generated Rs 10 crore of income and reported zero EBITDA, compared with a Rs 3 crore EBITDA loss in H1 FY26.
The newer buildings contributed Rs 28 crore of income in Q2 FY27, compared with Rs 2 crore in Q2 FY26, and generated Rs 13 crore of EBITDA after a Rs 1 crore EBITDA loss a year earlier. The operational portfolio remained the larger quarterly contributor, at Rs 61 crore of income and Rs 43 crore of EBITDA in Q2 FY27.
Got a follow-up? Ask IRIS
What is Phoenix Mills' office occupancy and leasing position?
Phoenix Mills had 4.77 million square feet of net leasable area in its commercial-office portfolio at September 2026, of which 3.77 million square feet was leased, representing 79% occupancy. The portfolio included 1.89 million square feet of operational assets and 2.87 million square feet of offices completed during 2025.
The operational office group was 83% leased in September 2026, up from 77% in September 2025. Its gross rent was Rs 118 per square foot per month, compared with Rs 95 per square foot per month for the 2025-completed offices; Phoenix Mills stated that September 2026 gross rent includes common-area maintenance and property tax.
The three newer assets were at different leasing levels in September 2026. Phoenix Asia Towers was 84% leased across 0.81 million square feet, Millennium Towers was 78% leased across 1.47 million square feet, and One National Park was 64% leased across 0.60 million square feet.
Which operational assets drove Phoenix Mills' H1 FY27 office growth?
Fountainhead in Pune delivered the largest income increase among Phoenix Mills' operational assets, with H1 FY27 income rising 31% to Rs 41 crore from Rs 31 crore. Its EBITDA rose 35% to Rs 30 crore, and its EBITDA margin increased to 73% from 71%.
Art Guild House in Mumbai remained the largest operational income contributor, generating Rs 52 crore in H1 FY27, up 11% from Rs 47 crore. Its EBITDA increased to Rs 38 crore from Rs 34 crore, while its margin was 74%, compared with 73% in H1 FY26.
Phoenix Paragon recorded H1 FY27 income of Rs 21 crore, up 23% from Rs 17 crore, and EBITDA of Rs 13 crore, up 34% from Rs 10 crore. The asset listed as The Centrum in the income table moved in the opposite direction, reporting Rs 5 crore of income, down 21% from Rs 7 crore, and EBITDA of Rs 2 crore, down from Rs 4 crore.
Phoenix Mills reported gross leasing of about 6 lakh square feet across Mumbai, Pune, Bengaluru and Chennai during H1 FY27. That leasing activity occurred alongside tenant move-ins at Phoenix Asia Towers, One National Park and Millennium Towers, which together had 2.21 million square feet leased at September 2026.
Conclusion
Phoenix Mills' H1 FY27 office result combined continued growth at established assets with a larger income base from the three buildings completed during 2025. Total income rose Rs 58 crore to Rs 163 crore, of which the newer offices supplied a Rs 41 crore year-on-year increase, while operational assets added Rs 17 crore.
The next disclosed indicators to watch are leasing conversion and tenant move-ins at the newer buildings, particularly One National Park, which was 64% leased in September 2026 versus 84% at Phoenix Asia Towers and 78% at Millennium Towers. Phoenix Mills also reported about 6 lakh square feet of gross leasing in H1 FY27 across four cities, while total office occupancy stood at 79%.