










Phoenix Mills' H1 consumption rises 28%, led by Mall of Asia
Key highlights
- Phoenix Mills reported H1 FY27 retail consumption of Rs. 9,415 crore, up 28% year on year.
- Phoenix Mall of Asia led growth with H1 FY27 consumption of Rs. 1,501 crore, up 81% year on year.
- Retail rental income rose 16% to Rs. 1,200 crore, while retail asset EBITDA increased 17% to Rs. 1,264 crore in H1 FY27.
- All 12 reported malls recorded positive H1 FY27 consumption growth, with growth ranging from 9% at PU Bareilly to 81% at Phoenix Mall of Asia.
powered by IRIS
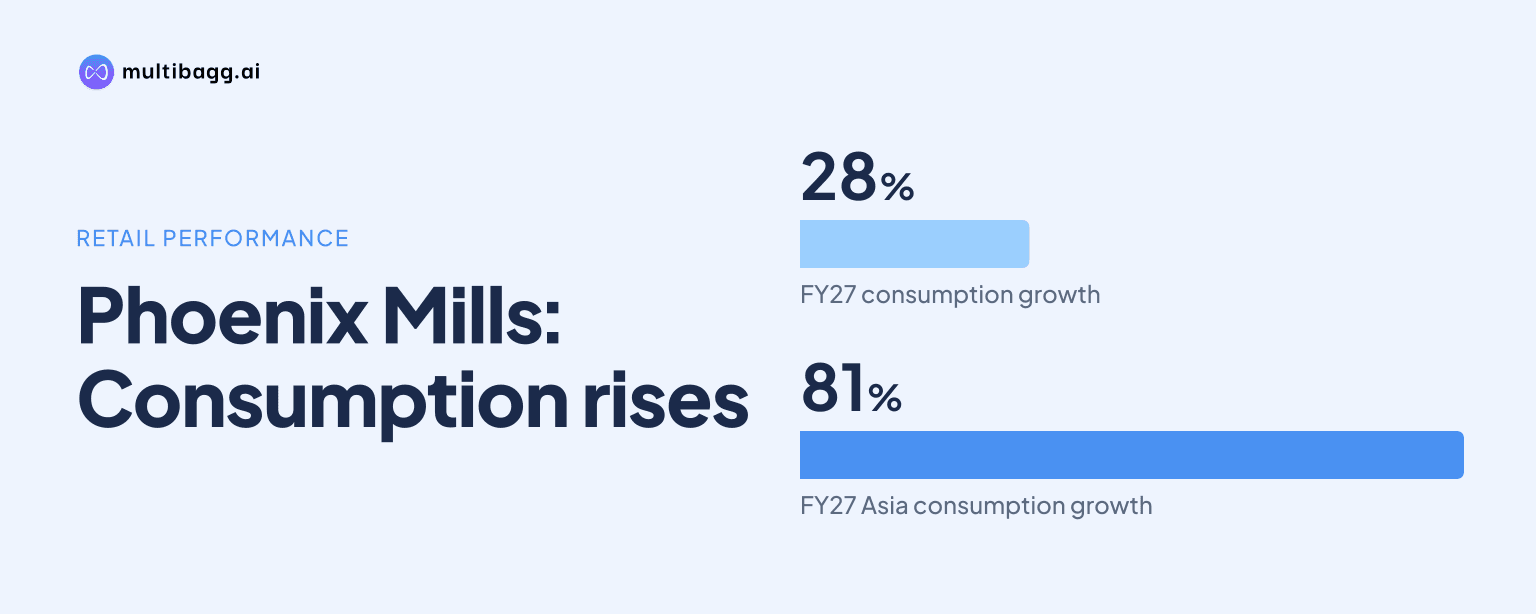
Phoenix Mills reported Rs. 9,415 crore of retail consumption in H1 FY27, up 28% year on year, led by Phoenix Mall of Asia at Rs. 1,501 crore and 81% growth. All 12 reported malls recorded positive consumption growth, while retail rental income rose 16% to Rs. 1,200 crore.
Know Phoenix Mills inside out
Results, valuation, peers and who's buying, in one view.
How much did Phoenix Mills' retail consumption grow in H1 FY27?
Phoenix Mills' retail consumption rose 28% year on year to Rs. 9,415 crore in H1 FY27, compared with Q2 FY27 consumption growth of 25% to Rs. 4,685 crore. The reported first-half result covered positive year-on-year growth at each of the 12 malls listed in the presentation.
Phoenix Mills' retail rental income increased 16% year on year to Rs. 1,200 crore in H1 FY27, while retail asset earnings before interest, tax, depreciation and amortisation, or EBITDA, rose 17% to Rs. 1,264 crore. Consumption therefore grew 12 percentage points faster than rental income and 11 percentage points faster than retail asset EBITDA during the half.
In Q2 FY27, Phoenix Mills recorded Rs. 605 crore in retail rental income, up 15% from Q2 FY26, and Rs. 639 crore in retail asset EBITDA, up 18%. Q2 consumption of Rs. 4,685 crore was close to half the H1 FY27 total of Rs. 9,415 crore, based on the presentation's reported figures.
Which Phoenix Mills mall recorded the fastest H1 FY27 growth?
Phoenix Mall of Asia recorded the fastest H1 FY27 consumption growth among the 12 malls listed by Phoenix Mills, rising 81% year on year to Rs. 1,501 crore. It was also the largest reported mall by H1 consumption, ahead of Phoenix Palladium at Rs. 1,393 crore and Phoenix MarketCity Bangalore at Rs. 1,083 crore.
Phoenix Mall of Asia's Rs. 1,501 crore H1 result exceeded Phoenix Palladium's Rs. 1,393 crore by Rs. 108 crore, despite Phoenix Palladium recording 21% year-on-year growth. In Q2 FY27, Phoenix Mall of Asia generated Rs. 777 crore, up 68%, compared with Phoenix Palladium's Rs. 682 crore, up 17%.
The growth pattern was broad across Phoenix Mills' reported malls: all 12 locations posted a positive H1 comparison. Excluding Phoenix Mall of Asia's 81% increase, reported H1 growth ranged from 9% at PU Bareilly to 28% at Phoenix Mall of the Millennium, while Palladium Ahmedabad grew 26%.
Got a follow-up? Ask IRIS
Which spending categories drove Phoenix Mills' Q2 FY27 consumption?
Fashion & Accessories remained Phoenix Mills' largest Q2 FY27 consumption category, accounting for 51% of spending and 61% of trading area, while consumption grew 22% year on year. Electronics recorded the fastest category growth at 39%, despite accounting for 13% of consumption and 3% of trading area.
Jewellery accounted for 15% of Q2 FY27 consumption and grew 28% on 2% of trading area. The Others category grew 34%, the second-fastest rate after electronics, while contributing 5% of consumption and occupying 4% of trading area.
Food & Beverages grew 21% year on year and represented 9% of Q2 consumption across 11% of trading area. FEC & Multiplex consumption increased 16% on 15% of trading area, while Gourmet & Hypermarket grew 14% on 4%; Phoenix Mills said it had undertaken initiatives to optimise hypermarket space and improve asset utilisation.
How did Phoenix Mills link repositioning to rental growth?
Phoenix Mills reported that Phoenix Avenue of Stars, Pune increased H1 FY27 consumption 25% to Rs. 1,045 crore and rental income 14% to Rs. 120 crore as repositioning introduced anchors and premium brands. The highlighted brands included UNIQLO, IKEA, MAX, BOSS, Michael Kors, Coach, Seiko, Victoria's Secret and Ethos.
At Phoenix Avenue of Stars, Pune, H1 FY27 trading density reached Rs. 2,397 per square metre, up 19% year on year. Its Q2 FY27 consumption was Rs. 509 crore, up 21%, while trading density rose 12% to Rs. 2,328 per square metre and rental income increased 16% to Rs. 60 crore.
Phoenix MarketCity Bangalore reported H1 FY27 consumption of Rs. 1,083 crore, up 20%, while rental income increased 21% to Rs. 117 crore. Its trading density rose 8% to Rs. 2,978 per square metre, and its new-brand list included UNIQLO, AZORTE, NEXT, Nykaa, Tira, Levi's, Bugatti, Foot Locker and LEGO.
Phoenix MarketCity Bangalore's Q2 FY27 figures showed rental income growing faster than consumption: consumption increased 19% to Rs. 542 crore, trading density rose 2% to Rs. 2,894 per square metre, and rental income climbed 25% to Rs. 61 crore. Phoenix Mills also listed Popeyes and Paul among food and beverage additions at both Phoenix Avenue of Stars, Pune and Phoenix MarketCity Bangalore.
Conclusion
Phoenix Mills' H1 FY27 data show portfolio-wide consumption growth to Rs. 9,415 crore, up 28% year on year, with Phoenix Mall of Asia supplying the largest reported consumption total and the fastest growth rate. Category results also showed electronics, jewellery and Others outgrowing the 25% Q2 portfolio consumption increase, while rental income and retail asset EBITDA rose 16% and 17%, respectively.
What to watch next is Phoenix Mills' roadmap to 2030, which management said is embedded in assets, land parcels and development rights already under its control. The plan includes rental repricing at lease expiries, additions of luxury and flagship brands, densification in Mumbai and Bengaluru, and new retail destinations in Kolkata, Surat, Thane, Chandigarh and Coimbatore.