










Rainbow lifts H1 patient volumes 21% as occupancy eases
Key highlights
- Rainbow’s H1 FY27 IP discharges and OP consultations each increased 21% to 59,592 and 917,704, respectively.
- Deliveries rose 22% to 10,629 in H1 FY27 from 8,736 a year earlier.
- Rainbow’s operational beds increased 20% to 1,886, while occupancy declined to 45.3% from 46.3%.
- H1 FY27 revenue rose 27.6% to Rs 1,018.01 crore, while profit increased 13.1% to Rs 146.43 crore.
powered by IRIS
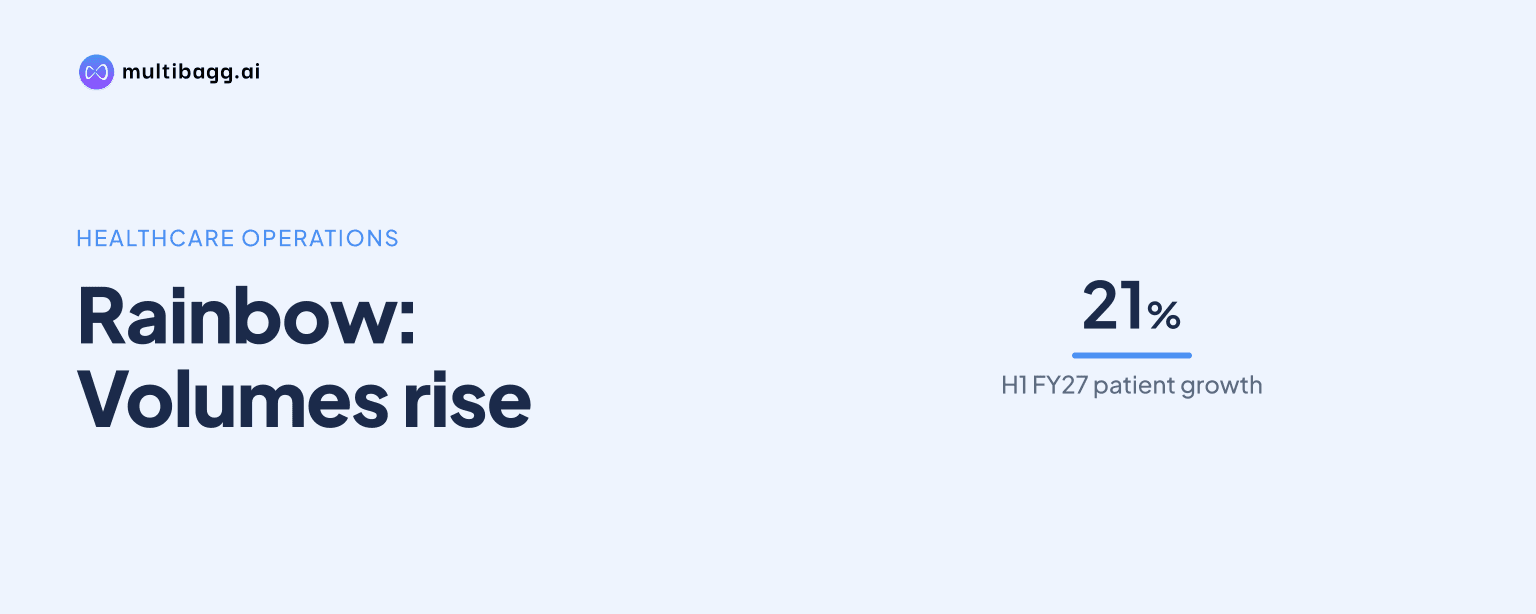
Rainbow Children’s Medicare Limited increased inpatient discharges and outpatient consultations by 21% each in the first half of fiscal year 2027 (H1 FY27), while deliveries rose 22%. Rainbow expanded operational beds 20% to 1,886, but occupancy declined to 45.3% from 46.3%, as measured using weighted average operated beds.
Know Rainbow Childrens Medicare inside out
Results, valuation, peers and who's buying, in one view.
What changed in Rainbow’s H1 FY27 operating metrics?
Rainbow’s patient volumes increased by more than 20% in H1 FY27, while occupancy declined by 1 percentage point year on year. Inpatient (IP) discharges reached 59,592 from 49,372 in H1 FY26, a 21% increase. Outpatient (OP) consultations rose to 917,704 from 756,926, also up 21%, and deliveries increased 22% to 10,629 from 8,736.
Rainbow’s capacity beds increased by 270 to 2,555, while operational beds increased by 314 to 1,886. The presentation says weighted average operated beds for the period are used to calculate occupancy. The 20% increase in operational beds was close to the 21% increase in IP discharges, while reported occupancy moved to 45.3% from 46.3%.
How did Rainbow’s new beds affect occupancy?
Rainbow reported a larger bed base and lower H1 FY27 occupancy, with capacity beds at 2,555 and occupancy at 45.3%. Capacity beds were 2,285 and occupancy was 46.3% in H1 FY26. The presentation describes the occupancy change as a 2% year-on-year decline on a relative basis.
The presentation says Rainbow Nellore commenced on 1 September with 70 capacity beds and 55 operational beds, while Rainbow Guntur commenced on the same date with 50 capacity beds and 40 operational beds. It also records a 60-capacity-bed facility, with 48 operational beds, commencing on 1 May. Together, these disclosed openings represented 180 capacity beds and 143 operational beds at commencement.
The H1 result can also be compared with the quarter. Q2 FY27 occupancy was 49.2%, above 41.2% in Q1 FY27 but below 52.0% in Q2 FY26. Q2 FY27 operational beds were 1,910, compared with 1,862 in Q1 FY27 and 1,621 in Q2 FY26.
Which hospital clusters drove Rainbow’s volume growth?
Rainbow’s emerging hospitals recorded the fastest H1 FY27 IP-discharge growth, with discharges rising 54% to 16,052 from 10,391. The cluster’s operational beds increased 29% to 476 from 370, while occupancy increased to 43.1% from 38.9%. Capacity beds remained unchanged at 635 in both H1 periods.
Mature hospitals reported H1 FY27 IP discharges of 40,723, up 4% from 38,981, with capacity beds unchanged at 1,550 and operational beds unchanged at 1,202. Occupancy increased to 49.6% from 48.6%. Average revenue per occupied bed (ARPOB) rose to Rs 68,962 from Rs 61,299, while average length of stay (ALOS) declined to 2.68 days from 2.74 days.
The cluster results show different utilisation levels. Mature hospitals had occupancy of 49.6%, which was 4.3 percentage points above the group’s 45.3%, while emerging hospitals had 43.1% occupancy and added 5,661 IP discharges. The presentation provides no comparable H1 FY26 operating metrics for new hospitals, which are defined as facilities that commenced after 1 April 2024.
Got a follow-up? Ask IRIS
What do Q2 FY27 results show about Rainbow’s new hospitals?
Rainbow’s new hospitals increased Q2 FY27 IP discharges and occupancy from Q1 FY27, although their occupancy remained below that of mature and emerging hospitals. The five new hospitals reported 1,758 IP discharges, up 66% from 1,059 in Q1 FY27. Occupancy rose to 27.4% from 22.6%, while operational beds increased to 232 from 184.
The new-hospital group comprises Rajahmundry, Electronic City, HBR, Nellore and Guntur. It had 370 capacity beds in Q2 FY27, compared with 250 in Q1 FY27. ARPOB was Rs 42,701, compared with Rs 42,460 in Q1 FY27, and ALOS declined to 3.32 days from 3.58 days.
In Q2 FY27, mature hospitals accounted for 73% of group revenue and 63% of group beds, with occupancy of 54%. Emerging hospitals accounted for 22% of revenue and 25% of beds, with occupancy of 47%. New hospitals represented 12% of beds and 4% of revenue, with occupancy of 27%; the presentation reports their pre-Ind AS 116 earnings before interest, tax, depreciation and amortisation (EBITDA) margin at negative 16%.
How did operating growth translate into Rainbow’s H1 financial performance?
Rainbow’s H1 FY27 revenue from operations increased 27.6% to Rs 1,018.01 crore from Rs 797.73 crore in H1 FY26. Profit for the period increased 13.1% to Rs 146.43 crore from Rs 129.43 crore. Total expenses rose 29.3% to Rs 843.39 crore from Rs 652.20 crore, exceeding the revenue growth rate.
EBITDA, excluding other income and after the Ind AS 116 accounting impact, rose 20.6% to Rs 304.63 crore from Rs 252.49 crore. The reported H1 EBITDA margin was 29.9%, compared with 31.7% in H1 FY26, and the profit margin was 14.4%, compared with 16.2%. Professional fees to doctors increased 33.3% to Rs 264.12 crore, while other expenses increased 33.0% to Rs 168.93 crore.
Rainbow’s group ARPOB increased 9% to Rs 65,131 from Rs 59,876, despite the decline in occupancy. ALOS declined 3% to 2.62 days from 2.70 days. The 21% increase in discharges, higher ARPOB and shorter reported stays occurred alongside the 20% expansion in operational beds.
Conclusion
Rainbow’s H1 FY27 results show growth across inpatient, outpatient and maternity activity, with IP discharges and OP consultations each increasing 21% and deliveries increasing 22%. At the same time, operational beds rose 20% to 1,886 and occupancy declined to 45.3%, reflecting a larger operated-bed base alongside increased patient activity.
The next item to watch is the absorption of beds at the facilities disclosed as commencing on 1 May and 1 September. Q2 FY27 new-hospital occupancy of 27.4%, compared with 47.2% at emerging hospitals and 54.2% at mature hospitals, provides the disclosed starting point for assessing utilisation at newer locations; the presentation gives no occupancy target for these sites.