










Rainbow Children's Hospital mature sites lift ARPOB 13%
Key highlights
- Rainbow’s mature-hospital ARPOB rose 13% year on year to Rs 66,922 in Q2 FY27 from Rs 59,097.
- Mature-hospital inpatient discharges increased 2% to 22,103, while occupancy edged down to 54.2% from 54.5%.
- Mature hospitals maintained 1,550 capacity beds and 1,202 operational beds in Q2 FY27, with no bed expansion year on year.
- Mature hospitals contributed 73% of group revenue and recorded a 28% pre-Ind AS 116 EBITDA margin in Q2 FY27.
powered by IRIS
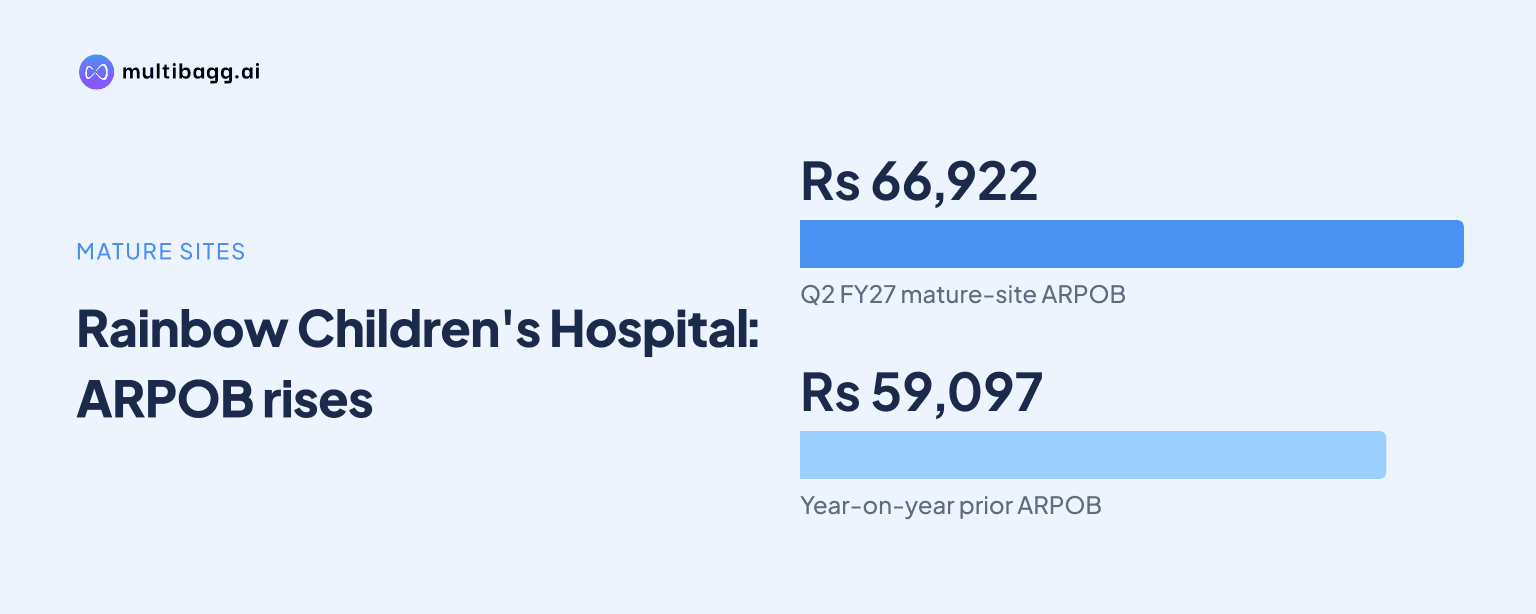
Rainbow Children's Hospital reported a 13% year-on-year increase in average revenue per occupied bed (ARPOB) at its mature hospitals to Rs 66,922 in Q2 FY27. Inpatient discharges rose 2% to 22,103, while capacity stayed at 1,550 beds and operational beds at 1,202, indicating that the reported gain came without expansion in the mature cluster.
Know Rainbow Childrens Medicare inside out
Results, valuation, peers and who's buying, in one view.
What did Rainbow mature hospitals report in Q2 FY27?
Rainbow reported Q2 FY27 ARPOB of Rs 66,922 at mature hospitals, compared with Rs 59,097 in Q2 FY26, a 13% increase. Inpatient discharges rose to 22,103 from 21,683, while occupancy eased to 54.2% from 54.5% and average length of stay (ALOS) declined to 2.71 days from 2.78 days.
The cluster had 1,550 capacity beds and 1,202 operational beds in Q2 FY27, unchanged from both Q2 FY26 and Q1 FY27. Rainbow defines mature hospitals as those that had completed five years of operations, or commenced on or before 31 March 2021; the Q2 cluster comprised 14 hospitals.
Why was ARPOB the main reported change at Rainbow mature hospitals?
ARPOB was the largest reported movement among Rainbow’s mature-hospital operating indicators because beds were unchanged, discharges grew by 420 and occupancy fell by 0.3 percentage points year on year. ARPOB increased by Rs 7,825 between Q2 FY26 and Q2 FY27, despite the broadly stable bed base and utilisation rate.
The presentation does not break ARPOB into tariff, case mix, treatment intensity or payor components for the mature cluster. At the group level, pediatrics represented 65% of Q2 FY27 specialty mix, down from 67% in Q2 FY26; women care rose to 30% from 29%, while in-vitro fertilisation (IVF) rose to 5% from 3%. These specialty figures include outpatient revenue.
Rainbow’s group payor mix changed marginally during the same period. Cash represented 63.3% of total revenue in Q2 FY27, compared with 63.9% in Q2 FY26, while insurance represented 36.7%, up from 36.1%; the data cover total revenue including outpatient revenue and are not disclosed separately for mature hospitals.
How did Rainbow mature hospitals compare with other clusters?
Rainbow mature hospitals had the highest ARPOB and occupancy across its three maturity clusters in Q2 FY27. The maturity-wise table rounded mature-cluster ARPOB to Rs 67,000, versus Rs 59,000 for emerging hospitals and Rs 43,000 for new hospitals; occupancy was 54%, compared with 47% and 27%, respectively.
The mature cluster represented 73% of group revenue and 63% of group beds in Q2 FY27. Its pre-Ind AS 116 earnings before interest, tax, depreciation and amortisation (EBITDA) margin was 28%, compared with 26% for emerging hospitals and negative 16% for new hospitals; the table used pre-Ind AS 116 EBITDA.
Emerging hospitals delivered faster activity growth from a different base, with inpatient discharges increasing 32% year on year to 8,845 and ARPOB rising 15% to Rs 59,096. New hospitals increased discharges 66% sequentially to 1,758 and occupancy to 27.4% from 22.6%, but ARPOB increased 0.6% to Rs 42,701.
Got a follow-up? Ask IRIS
Did the Rainbow mature-hospital pattern continue in H1 FY27?
Yes. Rainbow reported a 13% increase in H1 FY27 mature-hospital ARPOB to Rs 68,962 from Rs 61,299 in H1 FY26. Inpatient discharges grew 4% to 40,723 from 38,981, while capacity and operational beds remained at 1,550 and 1,202, respectively.
H1 FY27 occupancy at mature hospitals rose to 49.6% from 48.6%, unlike the small Q2 decline, and ALOS fell to 2.68 days from 2.74 days. Across the group, occupancy declined to 45.3% from 46.3% as operational beds increased 20% to 1,886 and inpatient discharges grew 21% to 59,592.
Rainbow’s H1 maturity table showed mature hospitals accounting for 73% of group revenue and 64% of beds, with 50% occupancy and a 27% pre-Ind AS 116 EBITDA margin. Emerging hospitals accounted for 22% of revenue and 25% of beds, while new hospitals represented 4% of revenue and 11% of beds.
What should readers watch in Rainbow mature-hospital data?
Readers should monitor whether ARPOB remains above the Q2 FY27 level of Rs 66,922 as occupancy and discharge volumes change. ARPOB was lower than Rs 71,444 in Q1 FY27, even as Q2 inpatient discharges rose to 22,103 from 18,620 and occupancy increased to 54.2% from 45.0%.
Readers should also distinguish the mature cluster from Rainbow’s newer-site expansion. Group capacity beds increased 12% year on year to 2,555 in Q2 FY27 and operational beds rose 18% to 1,910; Nellore and Guntur commenced operations on 1 September with 70 and 50 capacity beds, respectively, while RHBR commenced on 1 May with 60 capacity beds.
Conclusion
Rainbow’s reported mature-hospital data show a 13% year-on-year ARPOB increase in both Q2 and H1 FY27 while capacity remained at 1,550 beds and operational beds at 1,202. Q2 discharges rose 2% and occupancy edged down, separating the mature cluster’s revenue-per-occupied-bed trend from capacity expansion or substantial volume growth.
The next comparison will show whether mature-hospital ARPOB moves from Rs 66,922 in Q2 FY27 toward the Rs 71,444 reported in Q1 FY27 and whether occupancy remains near 54.2%. Rainbow’s May and September commencements add capacity outside the mature cluster, so future group results will require separation of mature-hospital metrics from emerging and new-hospital growth.