










Rainbow Children's Hospital H1 FY27 revenue rises 28%, margins fall
Key highlights
- Rainbow’s H1 FY27 revenue from operations rose 27.6% to Rs 1,018.01 crore.
- Total expenses increased 29.3% to Rs 843.39 crore, outpacing revenue growth.
- EBITDA margin fell to 29.9% from 31.7%, while PAT margin declined to 14.4% from 16.2%.
- Operational beds increased 20% to 1,886, but group occupancy declined to 45.3% from 46.3%.
powered by IRIS
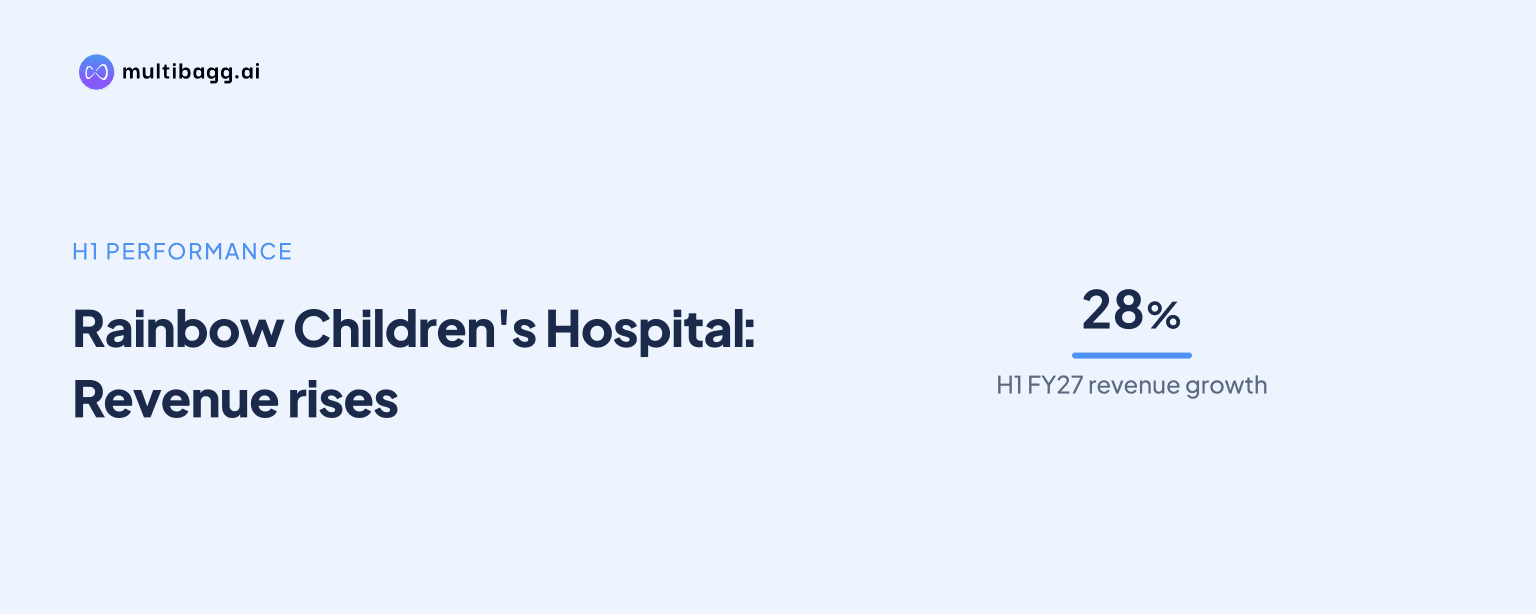
Rainbow Children's Hospital reported H1 FY27 revenue from operations of Rs 1,018.01 crore, up 27.6% year on year, but total expenses increased faster at 29.3%. As a result, Rainbow’s EBITDA margin declined to 29.9% from 31.7%, while profit after tax margin fell to 14.4% from 16.2%.
Know Rainbow Childrens Medicare inside out
Results, valuation, peers and who's buying, in one view.
How much did Rainbow's revenue grow in H1 FY27?
Rainbow’s revenue from operations grew 27.6% to Rs 1,018.01 crore in H1 FY27 from Rs 797.73 crore in H1 FY26. Total income increased 25.8% to Rs 1,038.84 crore, a lower rate than operating revenue because other income declined 26.1% to Rs 20.84 crore from Rs 28.21 crore.
Q2 FY27 revenue from operations was Rs 548.02 crore, up 23.2% from Rs 444.80 crore in Q2 FY26 and 16.6% from Rs 469.99 crore in Q1 FY27. Both quarters therefore contributed to first-half growth, although the Q2 year-on-year rate was below the 27.6% growth reported for H1 FY27.
Why did Rainbow's EBITDA and PAT margins contract?
Rainbow’s earnings before interest, tax, depreciation and amortisation, or EBITDA, margin fell 1.8 percentage points to 29.9% in H1 FY27 from 31.7% in H1 FY26. Profit after tax, or PAT, margin also declined 1.8 percentage points to 14.4% from 16.2%, as EBITDA rose 20.6% to Rs 304.63 crore and PAT increased 13.1% to Rs 146.43 crore, both more slowly than revenue.
The reported EBITDA figure is after Indian Accounting Standard 116, or Ind AS 116, and excludes other income. On a pre-Ind AS 116 basis, EBITDA excluding other income increased 21.2% to Rs 250.65 crore from Rs 206.73 crore, while the Ind AS 116 impact rose 18.0% to Rs 53.98 crore. Profit before tax increased 12.5% to Rs 195.46 crore, and total tax expense rose 10.6% to Rs 49.02 crore.
Which costs grew faster than Rainbow's revenue?
Rainbow’s total expenses rose 29.3% to Rs 843.39 crore in H1 FY27 from Rs 652.20 crore, exceeding the 27.6% increase in revenue from operations. Professional fees to doctors grew 33.3% to Rs 264.12 crore and other expenses increased 33.0% to Rs 168.93 crore, making both the fastest-growing major cost lines disclosed for the half year.
Employee benefits expense increased 28.6% to Rs 142.03 crore, also above revenue growth, whereas cost of materials consumed rose 26.1% to Rs 138.31 crore. Finance costs increased 17.0% to Rs 43.20 crore and depreciation and amortisation rose 24.0% to Rs 86.80 crore. In Q2 FY27, total expenses rose 26.8% to Rs 444.65 crore, compared with a 23.2% increase in quarterly operating revenue.
Got a follow-up? Ask IRIS
What do Rainbow's H1 FY27 operating indicators show?
Rainbow expanded operational beds by 20% to 1,886 in H1 FY27 from 1,572 in H1 FY26, while capacity beds increased 12% to 2,555. Inpatient discharges rose 21% to 59,592, outpatient consultations rose 21% to 9,17,704, and deliveries increased 22% to 10,629, alongside the 27.6% rise in operating revenue.
Group occupancy was 45.3% in H1 FY27, compared with 46.3% in H1 FY26, as operational beds grew faster than capacity beds. Average revenue per occupied bed, or ARPOB, increased 9% to Rs 65,131, while average length of stay, or ALOS, declined 3% to 2.62 days from 2.70 days. The presentation states that occupancy calculations use weighted average operational beds for the period.
How did Rainbow's hospital clusters differ in H1 FY27?
Rainbow’s 14 mature hospitals generated 73% of group revenue and held 64% of group beds in H1 FY27, with 50% occupancy and 27% EBITDA before Ind AS 116. The seven emerging hospitals accounted for 22% of revenue and 25% of beds, reporting 43% occupancy and 24% pre-Ind AS 116 EBITDA. Five new hospitals contributed 4% of revenue from 11% of beds and recorded negative 22% pre-Ind AS 116 EBITDA.
The emerging cluster increased operational beds to 476 from 370 while keeping capacity beds at 635 in both H1 periods. Its inpatient discharges rose 54% to 16,052, occupancy improved to 43.1% from 38.9%, and ARPOB increased 10% to Rs 59,770. Mature hospitals had unchanged capacity of 1,550 beds and operational beds of 1,202, while their discharges rose 4% to 40,723 and ARPOB increased 13% to Rs 68,962.
How did Rainbow's revenue mix change in H1 FY27?
Rainbow’s pediatrics share of revenue declined to 64% in H1 FY27 from 66% in H1 FY26, while women care increased to 31% from 30%. In vitro fertilisation, or IVF, rose to 5% of revenue from 3%, with the specialty mix including outpatient revenue.
Within pediatrics super-specialties, secondary care represented 44% in H1 FY27, down from 47% a year earlier. Tertiary care increased to 34% from 31%, and quaternary care rose to 23% from 22%. The payor profile was broadly unchanged, with cash at 64.2% of revenue versus 64.3% and insurance at 35.8% versus 35.7%.
Conclusion
Rainbow combined a 27.6% increase in H1 FY27 operating revenue with higher operational beds, inpatient discharges, consultations and deliveries. However, total expenses grew 29.3%, led by 33.3% growth in doctor professional fees and 33.0% growth in other expenses, causing EBITDA and PAT margins to each decline by 1.8 percentage points.
The next disclosed operating measures are utilisation and profitability across newer capacity. Rainbow reported 45.3% group occupancy, 43% occupancy for emerging hospitals and negative 22% pre-Ind AS 116 EBITDA for the five-hospital new cluster, while emerging hospitals added 106 operational beds during the H1 comparison period.