










Remus H1 revenue rose 53.4% as EBITDA margin fell to 4.87%
Key highlights
- Remus’s H1-FY27 consolidated operational revenue rose 53.4% to Rs 614.1 crore.
- Consolidated operating expenses increased 56.5% to Rs 584.2 crore, exceeding revenue growth.
- Consolidated EBITDA margin declined 185 basis points to 4.87% in H1-FY27.
- Standalone EBITDA margin increased 338 basis points to 34.94% in H1-FY27.
powered by IRIS
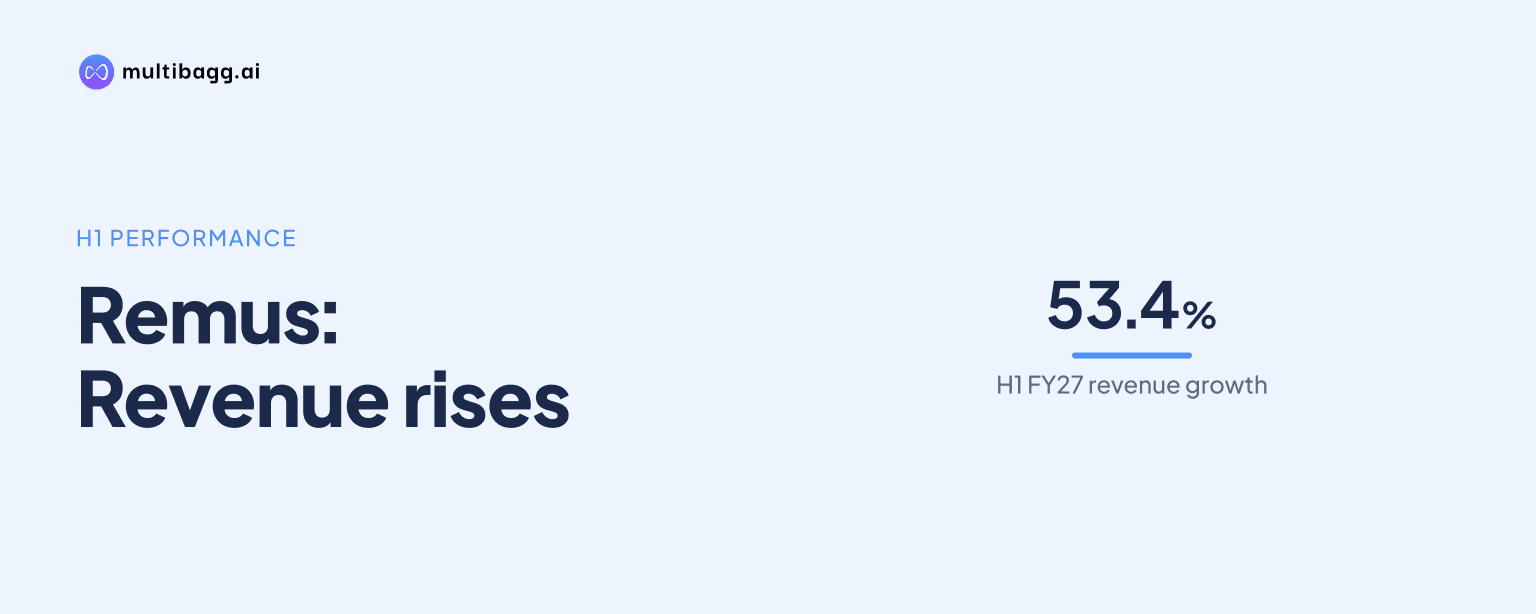
Remus reported H1-FY27 consolidated operational revenue of Rs 614.1 crore, up 53.4% year on year, but EBITDA margin fell 185 basis points to 4.87% as operating expenses rose 56.5%. EBITDA increased 11.2% to Rs 29.9 crore, substantially slower than revenue, while profit after tax rose 14.4% to Rs 24.7 crore.
Know Remus Pharmaceuticals inside out
Results, valuation, peers and who's buying, in one view.
Why did Remus’s EBITDA margin fall in H1-FY27?
Remus’s consolidated EBITDA margin fell because operating expenses increased faster than operational revenue in H1-FY27. Operating expenses rose 56.5% to Rs 584.2 crore from Rs 373.3 crore in H1-FY26, exceeding the 53.4% rise in operational revenue to Rs 614.1 crore from Rs 400.2 crore. EBITDA consequently rose only 11.2% to Rs 29.9 crore from Rs 26.9 crore.
The EBITDA margin declined to 4.87% from 6.72%, a fall of 185 basis points, where one basis point is one-hundredth of a percentage point. The presentation reports operating expenses as an aggregate number and does not provide an expense-category split, so it does not identify the individual costs responsible for the increase.
The margin also declined from the preceding half-year. H1-FY27 revenue was 35.4% above H2-FY26 revenue of Rs 453.4 crore, while operating expenses were 37.9% above Rs 423.6 crore. EBITDA was nearly unchanged at Rs 29.9 crore versus Rs 29.8 crore, reducing the margin from 6.57% by 170 basis points.
How did Remus’s consolidated profit change in H1-FY27?
Remus’s consolidated profit after tax, or PAT, rose 14.4% to Rs 24.7 crore in H1-FY27, while PAT margin declined 138 basis points to 4.02%. PAT was Rs 21.6 crore and the margin was 5.40% in H1-FY26. Net-profit growth therefore remained well below the 53.4% increase in operational revenue.
Profit before tax increased 14.0% to Rs 31.8 crore from Rs 27.9 crore. Other income rose 40.0% to Rs 4.2 crore, depreciation and amortisation increased 15.4% to Rs 1.5 crore, finance costs rose 14.3% to Rs 0.8 crore, and tax expense increased 12.7% to Rs 7.1 crore.
PAT was broadly flat against H2-FY26, when Remus reported Rs 24.6 crore, despite H1-FY27 revenue being Rs 160.7 crore higher. Diluted earnings per share were Rs 20.92, compared with Rs 20.86 in H2-FY26 and Rs 18.33 in H1-FY26. PAT attributable to owners of the holding company rose 24.6% to Rs 21.8 crore from Rs 17.5 crore year on year.
How did Remus’s standalone results compare with consolidated results?
Remus’s standalone business delivered higher margin and faster profit growth than the consolidated business in H1-FY27. Standalone operational revenue rose 32.4% to Rs 62.1 crore, EBITDA increased 46.6% to Rs 21.7 crore, and PAT grew 56.7% to Rs 18.8 crore.
Standalone EBITDA margin rose 338 basis points to 34.94% from 31.56%, unlike the consolidated EBITDA-margin decline to 4.87%. Standalone operating expenses increased 25.9% to Rs 40.4 crore from Rs 32.1 crore, which was slower than the 32.4% growth in standalone revenue.
Standalone PAT margin increased 468 basis points to 30.27% from 25.59%. Standalone profit before tax rose 53.4% to Rs 24.7 crore, while other income increased 60.7% to Rs 4.5 crore. The presentation therefore shows improving standalone profitability during the period of lower consolidated margins.
Got a follow-up? Ask IRIS
What does Remus’s historical consolidated performance show?
Remus’s historical data show that consolidated EBITDA margin declined from 13.62% in FY24 to 7.37% in FY25, 6.64% in FY26 and 4.87% in H1-FY27. Operational revenue rose from Rs 212.9 crore in FY24 to Rs 620.4 crore in FY25 and Rs 853.6 crore in FY26, while EBITDA increased from Rs 29 crore to Rs 45.7 crore and Rs 56.7 crore respectively.
PAT margin followed a similar path, falling from 11.41% in FY24 to 6.19% in FY25, 5.41% in FY26 and 4.02% in H1-FY27. H1-FY27 operational revenue of Rs 614.1 crore was 71.9% of FY26 revenue, whereas its EBITDA of Rs 29.9 crore was 52.7% of FY26 EBITDA. H1-FY27 is a half-year period and the presentation provides no annualised forecast.
The presentation notes that subsidiaries established or acquired during a financial year are included in consolidated financials from their incorporation or acquisition date, as applicable. This means comparisons across FY24, FY25, FY26 and H1-FY27 may include subsidiaries for different portions of each reported period.
What commercial developments did Remus disclose for H1-FY27?
Remus disclosed several market-access and portfolio actions, but did not quantify their revenue or profit contribution in H1-FY27. The company won a tender for 24 products in Bolivia, secured a direct government tender in Venezuela, and received Digemid approval for its plant in Peru, where it is filling more than 60 products.
Remus said it in-licensed several molecules for Mexico, Chile, Vietnam and Peru, supported by bioequivalence studies and focused on anti-infective and anti-allergy products. It also received approval for semaglutide tablets and injections, with commercialisation planned soon, and executed supply orders for rotigotine patches in Venezuela.
Other plans include discussions to in-license biosimilar products, a business-to-consumer launch in the Dominican Republic following trademark and brand approvals, and the introduction of more than five own-label brands in Guatemala. The presentation does not disclose an H2-FY27 target for revenue, EBITDA, EBITDA margin or PAT.
Conclusion
Remus’s H1-FY27 results show that consolidated revenue growth of 53.4% to Rs 614.1 crore did not translate proportionately into earnings growth, as operating expenses rose 56.5%. EBITDA increased 11.2% to Rs 29.9 crore and PAT rose 14.4% to Rs 24.7 crore, while EBITDA margin fell to 4.87% and PAT margin to 4.02%.
The next developments to watch are planned semaglutide commercialisation, the Dominican Republic business-to-consumer launch, more than five own-label brands planned for Guatemala, and potential biosimilar in-licensing. Remus has not provided H2-FY27 financial targets, leaving the relationship between operating-expense growth and revenue growth unresolved.