










Salzer short-term borrowings reached ₹503.36 crore in FY26
Key highlights
- Salzer’s short-term borrowings increased to ₹503.36 crore in FY26 from ₹435.04 crore in FY25.
- Salzer’s working capital rose to ₹292.6 crore in FY26, while working-capital days fell to 153 from 170.
- Salzer’s debt-to-equity ratio increased to 0.92 times in FY26 from 0.86 times in FY25.
- Salzer reported current borrowings of ₹568.8 crore as of September 30, 2026.
powered by IRIS
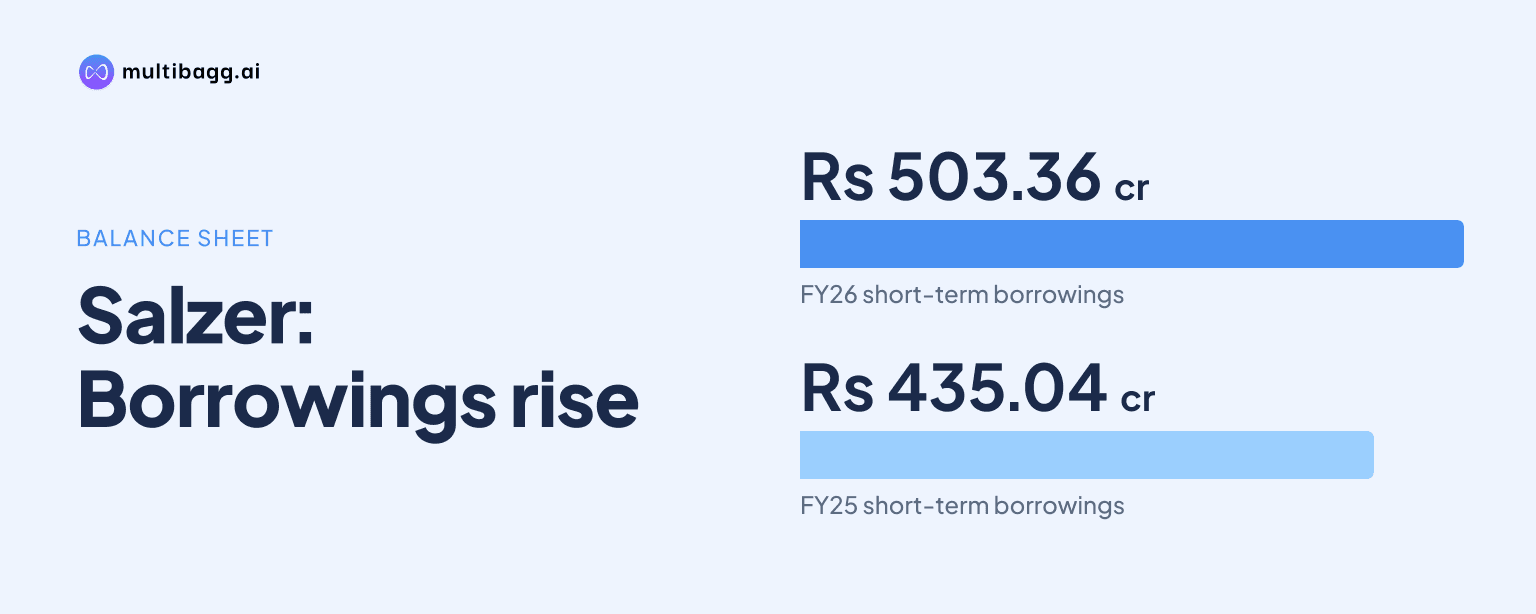
Salzer’s short-term borrowings reached ₹503.36 crore in FY26, up ₹68.32 crore from FY25, even as working-capital days fell by 17 to 153. Absolute working capital still increased to ₹292.6 crore, while the debt-to-equity ratio rose to 0.92 times from 0.86 times in the preceding financial year.
Know Salzer Electronics inside out
Results, valuation, peers and who's buying, in one view.
What happened to Salzer’s short-term borrowings in FY26?
Salzer’s short-term borrowings increased to ₹503.36 crore in FY26 from ₹435.04 crore in FY25. The ₹68.32 crore increase followed a ₹140.16 crore rise in FY25, when short-term borrowings increased from ₹294.88 crore in FY24. FY26 was the highest balance in the six-year borrowing series presented.
Salzer’s long-term borrowings also rose in FY26, reaching ₹28.08 crore from ₹22.32 crore in FY25. That ₹5.76 crore increase was smaller than the change in short-term funding, leaving a ₹475.28 crore gap between the two categories in FY26, against ₹412.72 crore in FY25. The reported increase in borrowings over the last two years was therefore concentrated in the short-term category.
How did Salzer’s working capital change in FY26?
Salzer’s working capital rose to ₹292.6 crore in FY26 from ₹272.5 crore in FY25, while its working-capital days declined to 153 from 170. The ₹20.1 crore increase in the absolute amount came alongside a 17-day reduction in the reported cycle, reversing the rise in days from 147 in FY23 to 167 in FY24 and 170 in FY25.
The working-capital amount increased in every year of the series, from ₹106.2 crore in FY21 to ₹122.3 crore in FY22, ₹181.6 crore in FY23 and ₹242.9 crore in FY24. FY26 working capital was ₹186.4 crore above FY21, although working-capital days were 26 below FY21’s 179 days. The presentation reports both measures but does not provide the formula for working-capital days.
How did Salzer’s leverage and capital returns compare with FY25?
Salzer’s debt-to-equity ratio increased to 0.92 times in FY26 from 0.86 times in FY25. The ratio, defined in the presentation as total debt divided by net worth, was also above 0.65 times in FY24 and 0.68 times in FY23. Net worth increased to ₹592.66 crore as of March 31, 2026, from ₹543.95 crore a year earlier.
Salzer’s return on capital employed, or ROCE, declined to 10.79% in FY26 from 11.59% in FY25, while return on equity fell to 9.07% from 9.65%. The presentation defines ROCE as earnings before interest and tax divided by total capital employed, which includes shareholders’ equity, long-term debt, short-term debt and current maturities of long-term debt, less non-current investments. FY26 ROCE remained above FY21’s 9.30% but below FY24’s 12.57%.
Got a follow-up? Ask IRIS
What operating performance coincided with Salzer’s FY26 funding position?
Salzer reported revenue of ₹1,758.4 crore in FY26, up ₹340.1 crore from ₹1,418.3 crore in FY25. Earnings before interest, tax, depreciation and amortisation, or EBITDA, increased to ₹147.1 crore from ₹133.9 crore. However, EBITDA margin declined to 8.4% in FY26 from 9.4% in FY25.
Salzer’s net profit increased to ₹53.8 crore in FY26 from ₹52.5 crore in FY25, while net profit margin declined to 3.1% from 3.7%. Earnings per share decreased to ₹29.94 from ₹35.3. These changes occurred alongside working capital of ₹292.6 crore and short-term borrowings of ₹503.36 crore, although the presentation does not attribute a direct cause between these measures.
What does Salzer’s September 2026 balance sheet show?
Salzer reported current borrowings of ₹568.8 crore as of September 30, 2026, compared with ₹503.36 crore as of March 31, 2026. Current assets increased to ₹1,108.42 crore from ₹998.91 crore over the same six-month period. Inventories rose by ₹25.74 crore to ₹494.09 crore, while trade receivables increased by ₹60.61 crore to ₹506.14 crore.
Salzer’s current liabilities reached ₹802.26 crore on September 30, 2026, up from ₹706.31 crore on March 31, 2026. Trade payables increased to ₹201.54 crore from ₹178.71 crore, and non-current borrowings rose to ₹33.27 crore from ₹28.08 crore. The September balance sheet shows higher current operating assets, liabilities and borrowings, but it does not provide an updated working-capital-days measure.
Conclusion
Salzer’s FY26 data show that a shorter reported working-capital cycle did not prevent the absolute working-capital requirement from rising. Working-capital days declined to 153 from 170, but working capital increased to ₹292.6 crore and short-term borrowings reached ₹503.36 crore. At the same time, debt to equity rose to 0.92 times and ROCE declined to 10.79%.
The next disclosed checkpoint is the September 30, 2026 balance sheet, where current borrowings had reached ₹568.8 crore. Management also shows a blended EBITDA-margin target of about 7.5% to 8% in FY27 and about 9% to 10% in FY28, linked to high-value engineered products and export-led stock-keeping units. Subsequent disclosures can indicate whether those plans coincide with changes in borrowing and working-capital needs.