










Sampre Nutritions Ltd Q2 FY27 Profit Falls 41% Despite Growth
Key highlights
- Sampre Nutritions Ltd's Q2 FY27 revenue from operations rose 32.9% year on year to ₹13.29 crore.
- Sampre Nutritions Ltd's Q2 FY27 profit after tax fell 41.1% year on year to ₹0.53 crore.
- Total expenses increased 41.5% year on year to ₹12.66 crore in Q2 FY27.
- Long-term borrowings fell to ₹5.13 crore at 30 September 2026 from ₹12.75 crore at 31 March 2026.
powered by IRIS
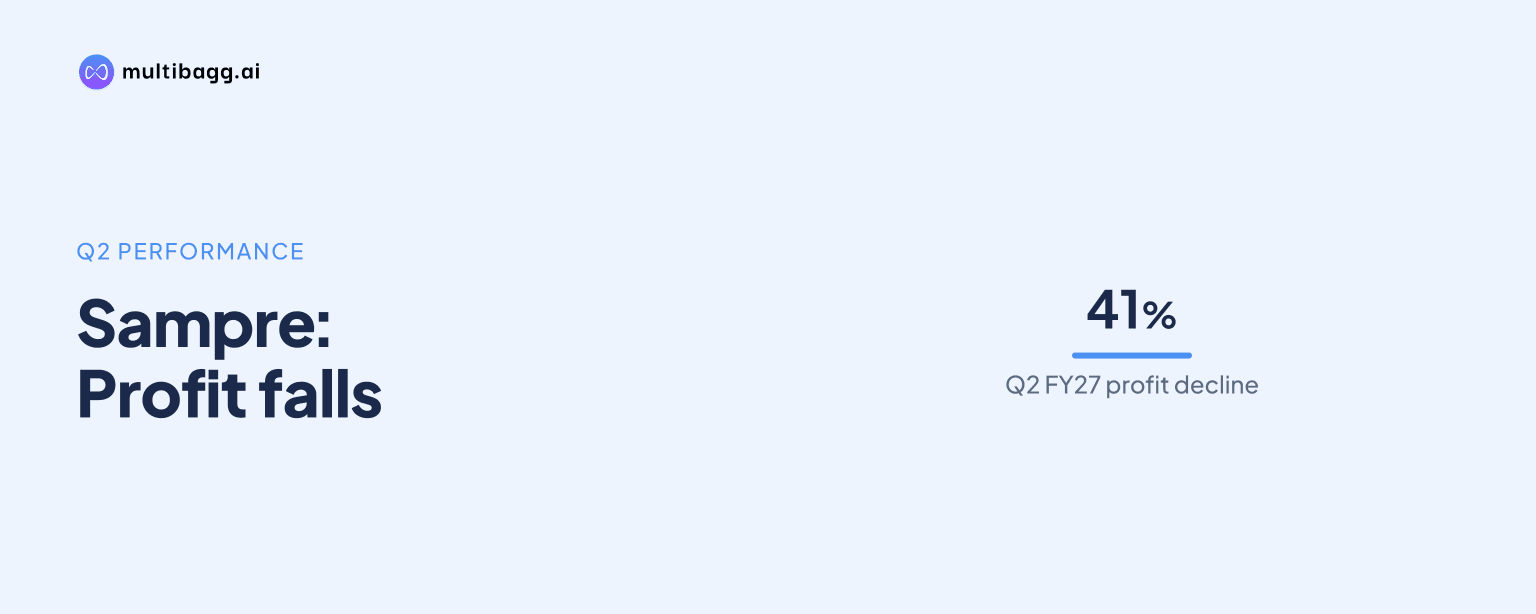
Sampre Nutritions Ltd reported a 41.1% year-on-year fall in profit after tax to ₹0.53 crore for Q2 FY27, even as revenue from operations rose 32.9% to ₹13.29 crore in the quarter ended 30 September 2026. The result shows that expenses grew faster than sales during the period.
Know Sampre Nutritions inside out
Results, valuation, peers and who's buying, in one view.
What did Sampre Nutritions Ltd report in Q2 FY27?
Sampre Nutritions Ltd reported standalone revenue from operations of ₹13.29 crore in Q2 FY27, compared with ₹10.00 crore in the corresponding quarter a year earlier. Total revenue was also ₹13.29 crore, while other income stood at ₹0.0049 crore, lower than ₹0.0054 crore in Q2 FY26.
Profit before tax declined to ₹0.64 crore from ₹1.06 crore a year earlier. Profit after tax fell to ₹0.53 crore from ₹0.89 crore, and basic earnings per share declined to ₹0.24 from ₹0.41. The company also reported that consolidated revenue and profit after tax were ₹13.29 crore and ₹0.53 crore, respectively, for the quarter.
The board approved the unaudited standalone and consolidated financial results for the quarter ended 30 September 2026 on 6 November 2026. The results were subject to limited review, according to the company disclosures.
Why did Sampre Nutritions Ltd's profit decline despite revenue growth?
Sampre Nutritions Ltd's profit declined because total expenses increased 41.5% year on year to ₹12.66 crore, outpacing the 32.9% rise in revenue. The gap between revenue growth and expense growth reduced the profit available after operating and tax costs.
Cost of materials consumed increased to ₹5.89 crore from ₹3.24 crore in the year-ago quarter, an increase of about 81.8%. Employee benefits expense rose to ₹3.86 crore from ₹2.69 crore. These two cost heads were specifically identified in the reported financial data as major expense increases during the quarter.
EBITDA was ₹1.60 crore, representing an EBITDA margin of 12.1%. There were no exceptional or extraordinary items in either Q2 FY27 or the corresponding quarter of FY26. As a result, the year-on-year change in earnings reflected operating costs rather than a one-time item disclosed in the results.
How did Q2 FY27 compare with Sampre Nutritions Ltd's previous quarter?
Sampre Nutritions Ltd's profit after tax fell 24.3% sequentially from ₹0.70 crore in Q1 FY27 to ₹0.53 crore in Q2 FY27. The decline followed a June 2026 quarter in which the company had reported revenue of ₹14.85 crore and net profit of ₹0.70 crore.
Revenue in Q2 FY27 was below the ₹14.85 crore reported in Q1 FY27, based on the quarterly figures provided. The reported Q2 numbers therefore show both a sequential moderation in revenue and a further reduction in profit after tax.
Got a follow-up? Ask IRIS
What does the result indicate about Sampre Nutritions Ltd's operations?
Sampre Nutritions Ltd's Q2 FY27 result indicates that its sales base expanded, but cost absorption weakened profitability. Revenue increased by ₹3.30 crore year on year, while total expenses rose by ₹3.71 crore. This explains why higher revenue did not translate into higher profit.
The company manufactures candy products and has been manufacturing for Cadbury India Ltd since August 1996. Its disclosed customer relationship is relevant because the company operates in contract manufacturing, where material costs, production volumes and operating efficiency can materially affect quarterly margins.
The result also follows a period of revenue movement in the company's recent quarterly history. Net sales turnover was ₹7.39 crore in December 2025, ₹15.10 crore in March 2026 and ₹14.85 crore in June 2026, before reaching ₹13.29 crore in September 2026. These reported figures provide context for the quarter's sales performance without establishing a future trend.
How did Sampre Nutritions Ltd's balance sheet and cash flow change?
Sampre Nutritions Ltd reduced both long-term and short-term borrowings as of 30 September 2026. Long-term borrowings fell to ₹5.13 crore from ₹12.75 crore as of 31 March 2026, while short-term borrowings declined to ₹3.84 crore from ₹5.16 crore.
Operating cash flow for the half-year ended 30 September 2026 was positive at ₹3.90 crore. This compares with a negative operating cash flow of ₹0.94 crore for the previous full financial year, according to the reported figures. The borrowing reduction and positive half-year operating cash flow are balance-sheet developments separate from the quarter's lower profit after tax.
For investors, the key operating issue in Q2 FY27 was the pace of cost growth. Materials consumption and employee expenses rose sharply while revenue growth remained positive, making margins and expense management central to assessing subsequent quarterly disclosures.
Conclusion
Sampre Nutritions Ltd delivered higher Q2 FY27 revenue but lower profit, with revenue rising 32.9% to ₹13.29 crore and profit after tax falling 41.1% to ₹0.53 crore. Expenses increased faster than revenue, particularly material consumption and employee benefits costs, resulting in a lower profit before tax and EPS.
The company has disclosed that its Q2 FY27 results were approved on 6 November 2026 and were subject to limited review. Investors can watch future quarterly results for changes in revenue, material and employee costs, EBITDA margin, operating cash flow and the company's borrowings.