










Savita volumes rose 31%, while FY26 unit EBITDA nearly halved
Key highlights
- Savita’s petroleum-products volume rose 31.3% to 5,13,110 KL/MT in FY26 from 3,90,744 KL/MT in FY22.
- Savita’s FY26 EBITDA per KL/MT was 4,555 rupees, down 50.1% from 9,137 rupees in FY22.
- Savita’s petroleum-products revenue increased to Rs 4,288 crore in FY26 from Rs 2,881 crore in FY22.
- Savita’s domestic share of petroleum-products revenue rose to 83% in FY26 from 80% in FY22.
powered by IRIS
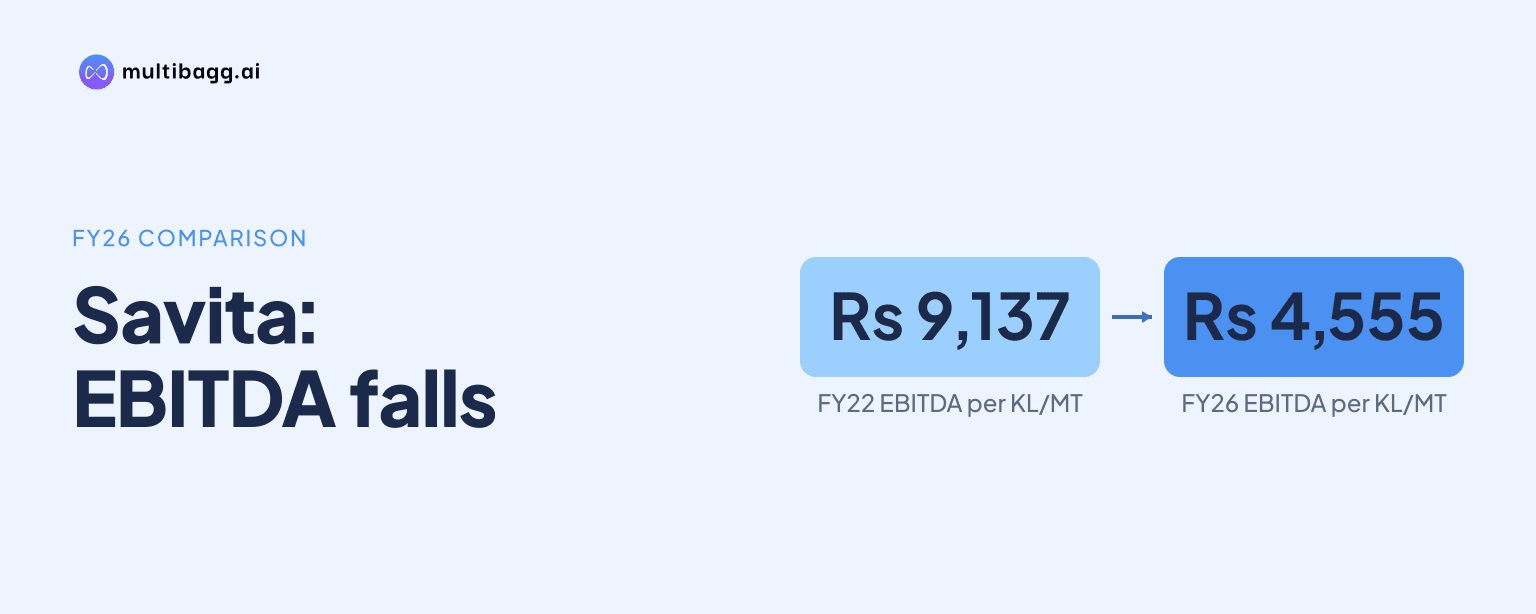
Savita Oil Technologies Ltd. increased petroleum-products volume to 5,13,110 KL/MT in FY26 from 3,90,744 KL/MT in FY22, a 31.3% rise, while earnings before interest, tax, depreciation and amortisation (EBITDA) per KL/MT fell 50.1% to 4,555 rupees from 9,137 rupees. Petroleum-products revenue increased 48.8% to Rs 4,288 crore over the same period.
Know Savita Oil Technologies inside out
Results, valuation, peers and who's buying, in one view.
How much did Savita’s petroleum-products volume grow?
Savita’s petroleum-products volume rose by 1,22,366 KL/MT between FY22 and FY26, reaching 5,13,110 KL/MT from 3,90,744 KL/MT. The path was not linear: volume slipped to 3,86,946 KL/MT in FY23, then increased to 4,18,404 KL/MT in FY24 and 4,40,136 KL/MT in FY25 before the FY26 increase of 72,974 KL/MT.
The FY26 increase was 16.6% from FY25, the largest annual increase in the five-year series presented. KL/MT is the presentation’s volume measure, referring to kilolitres and metric tonnes; Savita reports the petroleum-products data on a consolidated basis and excludes trading income, other income and the wind-power business.
Petroleum Specialty remained the larger revenue component, contributing Rs 3,142 crore in FY26 compared with Rs 1,147 crore from Lubricating Oils. Both segments expanded from FY22, but Lubricating Oils revenue rose 74.8%, compared with a 41.2% increase in Petroleum Specialty revenue, shifting the reported product mix modestly toward Lubricating Oils.
Why was Savita’s FY26 EBITDA per KL/MT lower than FY22?
Savita’s FY26 petroleum-products EBITDA per KL/MT was 4,555 rupees, down 4,582 rupees from 9,137 rupees in FY22. The reported per-unit measure declined in each of FY23, FY24 and FY25, before recovering from 3,691 rupees in FY25 to 4,555 rupees in FY26.
The FY26 recovery was 23.4% from FY25, but did not restore the levels reported in FY22 or FY23, when EBITDA per KL/MT was 8,380 rupees. FY24 EBITDA per KL/MT was 5,954 rupees, leaving the FY26 measure 1,399 rupees below that level despite the higher FY26 sales volume.
Savita’s realization, or revenue per KL/MT, was 83,577 rupees in FY26, 13.8% above 73,727 rupees in FY22. Realization reached 92,049 rupees in FY23 before declining to 87,849 rupees in FY24, 85,339 rupees in FY25 and 83,577 rupees in FY26, meaning revenue growth reflected higher volume alongside a realization level below the FY23 peak.
How did Savita’s petroleum revenue mix change?
Savita generated Rs 4,288 crore of petroleum-products revenue in FY26, compared with Rs 3,756 crore in FY25 and Rs 2,881 crore in FY22. The FY26 total rose 14.2% year on year, while the Rs 1,407 crore increase from FY22 exceeded the 31.3% rise in volume across the same period.
Domestic sales accounted for 83% of petroleum-products revenue in FY26, up from 80% in FY22, while exports represented 17%, down from 20%. The domestic share remained at 80% through FY24, rose to 82% in FY25 and reached 83% in FY26.
The two product segments moved differently during the period. Petroleum Specialty revenue rose from Rs 2,225 crore in FY22 to Rs 2,743 crore in FY24, fell to Rs 2,694 crore in FY25, and then increased to Rs 3,142 crore in FY26; Lubricating Oils revenue increased in every reported year, from Rs 656 crore to Rs 1,147 crore.
Got a follow-up? Ask IRIS
What do Savita’s consolidated results show alongside petroleum data?
Savita reported consolidated revenue, including other income, of Rs 4,408 crore in FY26, compared with Rs 2,969 crore in FY22, while EBITDA declined to Rs 291 crore from Rs 389 crore. Consolidated EBITDA margin was 6.6% in FY26, versus 13.1% in FY22, although it recovered from the five-year low of 5.4% in FY25.
Profit after tax increased to Rs 182 crore in FY26 from Rs 113 crore in FY25, but remained below Rs 260 crore in FY22. Return on equity (ROE) was 10% in FY26, compared with 7% in FY25 and 21% in FY22, while return on capital employed (ROCE) was 15%, compared with 11% and 29%, respectively; Savita says FY22 and FY23 data were restated following the amalgamation of Savita Polymers Ltd.
What operating plans has Savita disclosed?
Savita identifies industrial distribution expansion, capacity expansion, product innovation and a higher share of mid-tier and top-tier offerings as growth drivers for its SAVSOL business. The presentation calls industrial distribution-network expansion a key pillar, cites synthetic esters as an innovation example, and identifies Transformer, Industrial, Auto and Non-Auto as its product segments.
Savita has also disclosed a strategic multi-year partnership with Mahindra and Mahindra Limited’s Automotive and Farm Equipment Business. Under the arrangement, Savita will supply Mahindra Tractor Genuine Engine Oils under the MStar brand through Mahindra franchise workshops and spare-parts distributors in Savita-assigned geographies.
Conclusion
Savita’s FY26 data show a petroleum business with substantially higher volume and revenue than FY22, but with realization below its FY23 peak and EBITDA per KL/MT still 50.1% below the FY22 level. Consolidated FY26 EBITDA and profit after tax recovered from FY25, while EBITDA margin, ROE and ROCE remained below their FY22 readings.
The next reported periods will show whether FY26’s improvement in EBITDA per KL/MT, from 3,691 rupees to 4,555 rupees, can continue alongside volumes above 5,13,110 KL/MT. Management’s disclosed execution areas are industrial distribution expansion, capacity investments, premium and mid-premium product mix, synthetic-ester innovation and the Mahindra tractor-engine-oil partnership.