










SJS Q2 FY27 PAT rises 35% as EBITDA margin reaches 31%
Key highlights
- SJS Q2 FY27 operating revenue increased 16.9% year on year to Rs 282.73 crore.
- SJS Q2 FY27 EBITDA rose 23.1% to Rs 89.64 crore and EBITDA margin reached 31.0%.
- SJS Q2 FY27 PAT increased 34.8% year on year to Rs 58.33 crore, with a 20.6% margin.
- SJS H1 FY27 normalised PAT grew 39.4% to Rs 108.58 crore after excluding a Rs 24.17 crore exceptional gain.
powered by IRIS
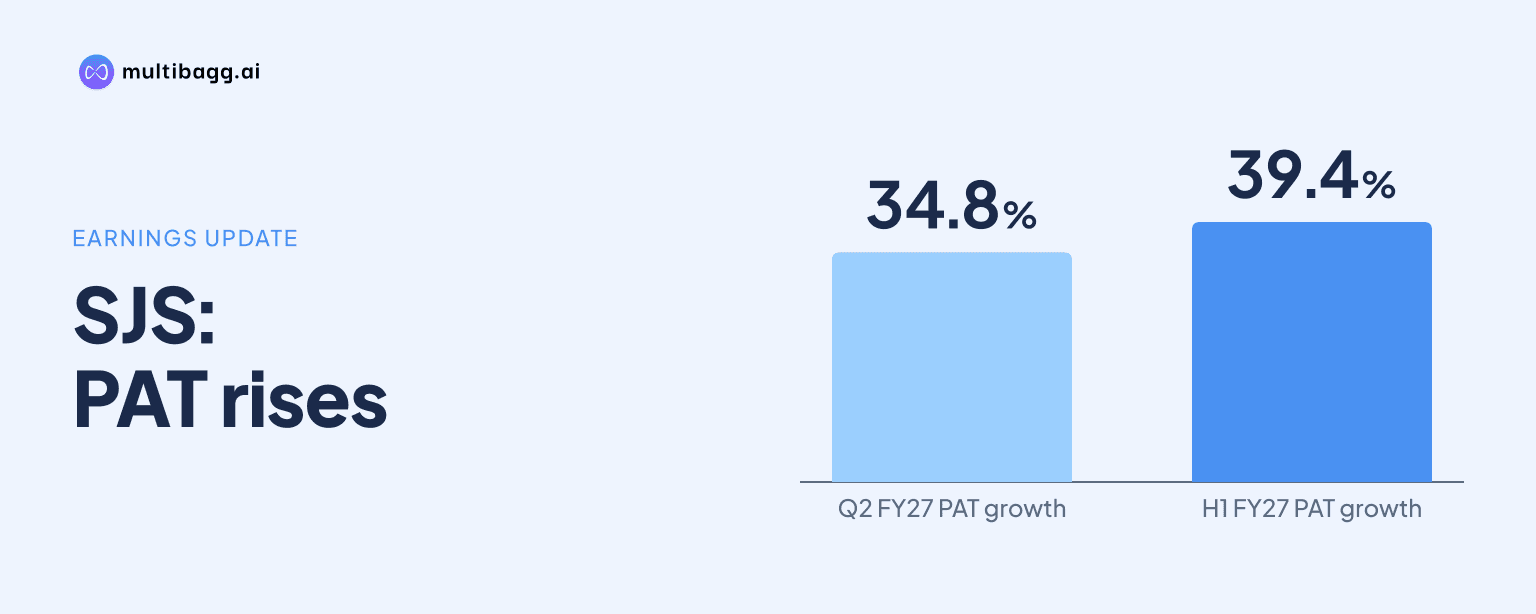
SJS Enterprises Limited reported Q2 FY27 profit after tax of Rs 58.33 crore, up 34.8% year on year, while EBITDA margin reached 31.0%. SJS attributed the 144-basis-point EBITDA margin expansion to an increasing export contribution, improved product mix and operational-efficiency improvements, as operating revenue rose 16.9% to Rs 282.73 crore.
Know S J S Enterprises inside out
Results, valuation, peers and who's buying, in one view.
How did SJS perform in Q2 FY27?
SJS grew profit and EBITDA faster than revenue in Q2 FY27. Operating revenue increased 16.9% year on year to Rs 282.73 crore, EBITDA rose 23.1% to Rs 89.64 crore, and both reported and normalised profit after tax, or PAT, increased 34.8% to Rs 58.33 crore. As the quarter had no exceptional gain, reported PAT and normalised PAT were identical.
The comparison with Q2 FY26 shows the margin change alongside sales growth. Revenue rose by Rs 40.97 crore from Rs 241.76 crore, while EBITDA increased by Rs 16.80 crore from Rs 72.84 crore. EBITDA margin rose to 31.0% from 29.6%, and PAT margin increased to 20.6% from 17.9%. Reported earnings per share increased to Rs 18.08 from Rs 13.73.
Sequentially, SJS revenue in Q2 FY27 was 8.3% above Q1 FY27, while EBITDA was 12.1% higher. Normalised PAT rose 16.1% quarter on quarter from Rs 50.25 crore. Reported PAT declined 21.6% from Rs 74.42 crore in Q1 FY27 because the preceding quarter included a Rs 24.17 crore post-tax exceptional gain.
Why did SJS EBITDA margin rise to 31%?
SJS said Q2 FY27 EBITDA margin expanded by 144 basis points year on year to 31.0% because of increasing exports contribution, better product mix and operational-efficiency improvement. EBITDA was Rs 89.64 crore, compared with Rs 72.84 crore in Q2 FY26, while the margin rose from 29.6% on revenue growth of 16.9%.
The margin also increased from 30.0% in Q1 FY27, when SJS recorded EBITDA of Rs 79.96 crore on revenue of Rs 261.00 crore. Revenue rose by Rs 21.73 crore sequentially in Q2 FY27, while EBITDA increased by Rs 9.68 crore. The presentation does not quantify the separate effects of export mix, product mix and individual efficiency measures.
At the PAT level, the Q2 FY27 margin of 20.6% was above the 17.9% margin in Q2 FY26 and the 19.3% normalised margin in Q1 FY27. The reported Q1 FY27 PAT margin was 28.5%, but it included the Rs 24.17 crore exceptional gain. On a normalised basis, PAT margin increased by 130 basis points sequentially.
Got a follow-up? Ask IRIS
Which businesses drove SJS Q2 FY27 revenue?
SJS reported domestic sales of Rs 254.48 crore in Q2 FY27, up 16.3% year on year, supported by 37.3% growth in its passenger vehicle, or PV, business. Domestic sales represented 90.0% of consolidated revenue. Exports were Rs 28.25 crore, up 23.1% year on year and accounting for 10.0% of quarterly revenue.
PV was SJS's largest disclosed end segment in Q2 FY27, representing 43.3% of revenue. Two-wheelers accounted for 38.9%, consumer products for 13.8%, and other segments for 4.0%. The presentation gives percentage splits rather than rupee revenue for each end segment.
By business, SJS accounted for 54.3% of consolidated Q2 FY27 revenue, SJS Decoplast represented 28.1%, and WPI represented 17.6%. The same business proportions were reported for H1 FY27. New-generation products contributed about 24% of consolidated H1 FY27 revenue, while the H1 geographic mix was 90.1% domestic and 9.9% exports.
What does SJS H1 FY27 show about profit, cash and returns?
SJS reported H1 FY27 operating revenue of Rs 543.73 crore, up 20.4% from Rs 451.41 crore in H1 FY26, and EBITDA of Rs 169.60 crore, up 28.9% from Rs 131.57 crore. EBITDA margin increased to 30.5% from 28.7%. Normalised PAT rose 39.4% to Rs 108.58 crore, with margin increasing to 20.0% from 17.3%.
Reported H1 FY27 PAT was Rs 132.75 crore, a 70.4% increase, because it included a Rs 24.17 crore one-time post-tax gain in Q1 FY27. SJS said the gain came from selling an old Bangalore facility that had not been in use since 2019. Excluding that item, normalised PAT growth was 39.4% against H1 FY26.
At H1 FY27, SJS had total debt of Rs 10.8 crore, comprising no long-term debt and Rs 10.8 crore of short-term debt. Cash and cash equivalents were Rs 342.7 crore, resulting in net cash of Rs 331.9 crore, compared with net cash of Rs 243.7 crore at FY26. Cash flow from operations was Rs 107.0 crore and free cash flow to firm was Rs 107.7 crore for H1 FY27.
SJS reported return on capital employed of 41.5% and return on equity of 22.8% for H1 FY27, compared with 36% and 20%, respectively, in FY26. Total equity was Rs 995.4 crore at H1 FY27, compared with Rs 881.0 crore at FY26. The presentation also states that ICRA upgraded SJS's long-term funds rating to AA- (Positive) from AA- (Stable).
Conclusion
SJS converted 16.9% Q2 FY27 revenue growth into 23.1% EBITDA growth and 34.8% PAT growth, lifting EBITDA margin to 31.0% and PAT margin to 20.6%. The stated drivers were a greater export contribution, better product mix and operating efficiencies, while 37.3% PV-business growth supported domestic sales of Rs 254.48 crore.
The next results will show whether exports, which represented 10.0% of Q2 FY27 revenue, and new-generation products, which contributed about 24% of H1 FY27 revenue, increase further. SJS's product pipeline describes future kit value of five to eight times per vehicle compared with a current Rs 3,500 to Rs 5,000 following the WPI acquisition, although the presentation provides no timing or financial target for that change.