










SMT Q2 EBITDA rises 36.6%, as margin reaches a record 17.6%
Key highlights
- SMT reported Q2 FY2027 revenue of about Rs 373 crore, up 24.7% year on year.
- SMT's Q2 FY2027 EBITDA rose 36.6% to Rs 65 crore and margin reached 17.6%.
- SMT's H1 FY2027 gross margin was 74.3%, down about 170 basis points from 76.0% a year earlier.
- SMT's ROW revenue grew 37% in H1 FY2027 and represented 40% of total revenue.
powered by IRIS
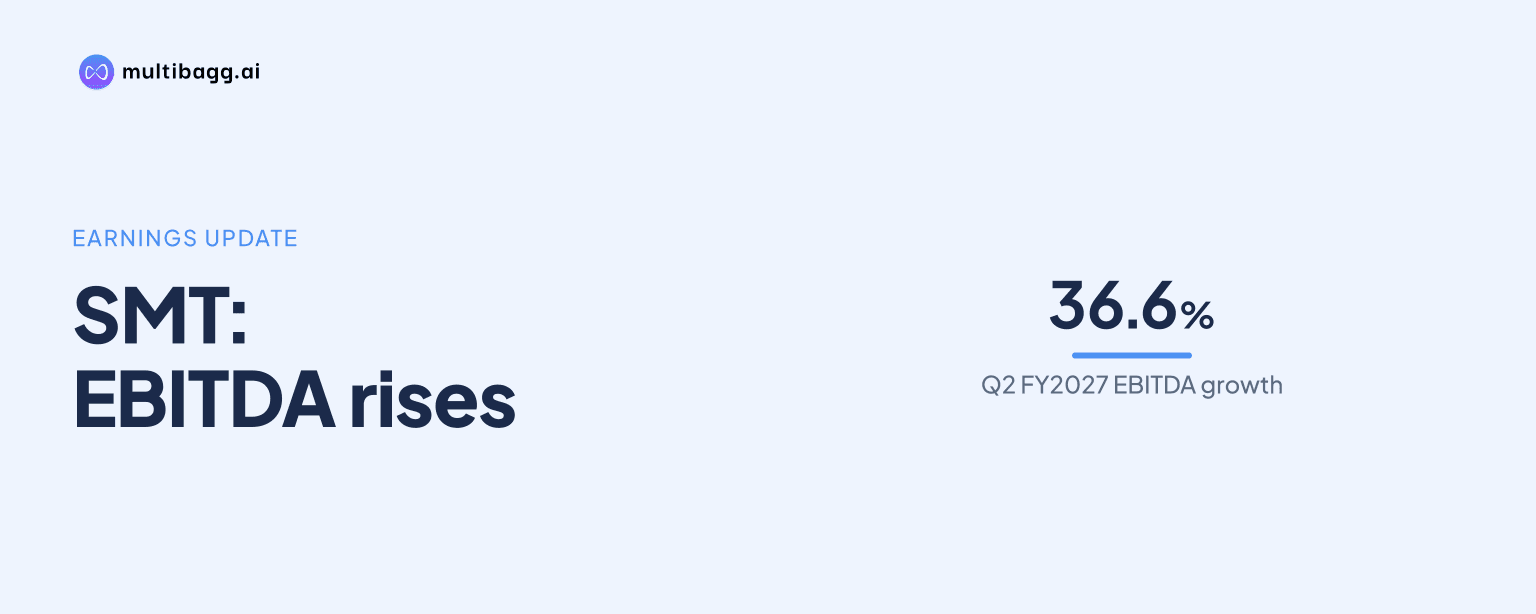
Sahajanand Medical Technologies Limited recorded Q2 FY2027 EBITDA of Rs 65 crore, up 36.6% year on year, with EBITDA margin reaching a record 17.6%. SMT reported revenue growth of 24.7% to about Rs 373 crore, while lower employee-cost and other-expense ratios more than offset gross-margin pressure from product mix, regional mix, input costs and labour costs.
Know Sahajanand Medical Technologies inside out
Results, valuation, peers and who's buying, in one view.
How did SMT perform in Q2 FY2027?
SMT delivered its highest-ever quarterly revenue, EBITDA and profit after tax, or PAT, in Q2 FY2027. Revenue increased 24.7% year on year to about Rs 373 crore, EBITDA rose 36.6% to Rs 65 crore and PAT grew 26.6% to Rs 26 crore. EBITDA therefore grew faster than both revenue and PAT during the quarter.
SMT reported EBITDA margin of 17.6% in Q2 FY2027, compared with 16.0% a year earlier, an expansion of 154 basis points as stated by management. A basis point is one-hundredth of a percentage point. Management attributed the increase to operating leverage from a larger revenue base and the use of established sales teams and channels for a wider product range.
Reported revenue growth included a currency benefit, particularly from Europe in H1 FY2027. On a constant-currency basis, which excludes exchange-rate movements, SMT said Q2 revenue rose about 16%, compared with reported growth of 24.7%. This indicates that foreign exchange was a contributor to the reported quarterly revenue increase.
Why did SMT's EBITDA margin rise despite gross-margin pressure?
SMT's EBITDA margin rose because employee costs and other expenses declined by a combined 350 basis points as shares of revenue. Employee cost fell to 27.1% of revenue from 28.8%, while other expenses declined to 29.7% from 31.5%. These reductions allowed EBITDA to grow about 37% in Q2 despite pressure on gross margin.
H1 FY2027 gross margin was 74.3%, down from 76.0% a year earlier, a decline of about 170 basis points. Management said around 150 basis points of the reduction came from mix, as traded products with lower gross margins grew faster than SMT's own products and regional revenue mix changed. The balance reflected higher input and labour costs, including investment in quality, while pricing remained broadly stable across product segments.
Management said the operating-leverage mechanism is to sell more products through the same sales teams, customers and channels. It cited direct commercial investments already made in Spain, Poland, Germany and France, where revenue can grow faster than staffing costs. The Chief Financial Officer guided for annual EBITDA-margin expansion of 150 to 200 basis points through FY2029 and indicated a margin of around 20% by FY2029.
Which products and regions drove SMT's H1 FY2027 growth?
SMT said all three product categories grew in H1 FY2027, with vascular intervention remaining the largest at 58% of revenue. Vascular intervention grew 16% year on year, while structural heart accelerated by about 40% in Q2. Both transcatheter aortic valve implantation, or TAVI, and occluder products grew about 40% during the quarter.
Other products were the fastest-growing category in H1 FY2027, increasing 52%, mainly because of intravascular ultrasound, or IVUS, in Europe. Management linked the faster expansion of traded products to the gross-margin decline because such products carry lower gross margins than SMT's internally made products. It did not disclose category-level revenue amounts.
Rest of world, or ROW, grew 37% in H1 FY2027 and became SMT's largest region at 40% of revenue. Europe grew 23% and represented 36% of revenue, while India improved from 6% growth in Q1 to 15% in Q2. Overall H1 revenue rose 24.9% to Rs 725 crore and EBITDA increased 43.4% to Rs 114 crore, producing a 15.7% EBITDA margin.
Reported H1 PAT increased 7.5% to Rs 41 crore, but the prior-year comparison included a one-off tax credit of Rs 8.7 crore related to earlier periods. Excluding that credit, management said H1 PAT grew about 39%. This comparison explains why reported PAT growth was below the 43.4% increase in H1 EBITDA.
Got a follow-up? Ask IRIS
What do SMT's cash flow, capacity and investment plans show?
SMT's cash conversion cycle improved to 128 days in H1 FY2027, from about 138 days in FY2026 and 144 days in FY2025. Capital employed rose by Rs 72 crore during the first half, almost entirely because of working capital supporting growth. Annualised return on capital employed rose to 16.7% from 12.2% in FY2026, while return on equity increased to 11.2% from 9.8%.
Cash flow from operations was Rs 47 crore in H1 FY2027, equal to 41% of EBITDA, compared with 62% in FY2026. Management said the first half normally includes a working-capital build. Free cash flow after capital expenditure and lease payments, before interest, was negative by Rs 1.8 crore after Rs 41 crore of H1 capital expenditure.
At the end of September 2026, SMT had around Rs 745 crore of equity, Rs 300 crore of borrowings and Rs 114 crore of cash and liquid investments. Net debt was about Rs 223 crore, or close to one time EBITDA, according to management. SMT guided for about Rs 70 crore of capital expenditure in FY2027 and FY2028, covering vertical integration, automation, Sachin plant maintenance and limited capacity enhancement.
Manufacturing utilisation shows differing capacity levels across sites. In H1 FY2027, drug-eluting stent, or DES, utilisation was 79% at Surat and 20% at Telangana, while balloon utilisation was 72% at Surat and 57% at Telangana. SMT said the new drug-coated balloon line at Surat was at 40%, and that Telangana's capacity provides room to increase revenue without proportionate capital spending.
Conclusion
SMT's Q2 FY2027 result showed EBITDA growth of 36.6% exceeding revenue growth of 24.7%, lifting margin to 17.6% despite a 170-basis-point decline in H1 gross margin. Growth across product categories and regions, especially ROW, structural heart and IVUS-led other products, combined with lower cost ratios to produce the operating leverage management described.
The next measures to watch are delivery against the roughly Rs 70 crore FY2027 capital-expenditure plan, utilisation growth at Telangana and management's target of 150 to 200 basis points of annual EBITDA-margin expansion through FY2029. Product milestones include Sironity's India commercialisation, Hydra Elevate's CDSCO approval and further European Union Medical Device Regulation filings before the end-2027 transition deadline.