










Tarsons Products Limited Posts Record Q2 Revenue, Exports Rise 37%
Key highlights
- Tarsons Products reported record consolidated Q2 FY27 revenue of ₹123.65 crore, up 20.8% year on year.
- Standalone Q2 FY27 revenue grew 25% and crossed ₹100 crore for the first time.
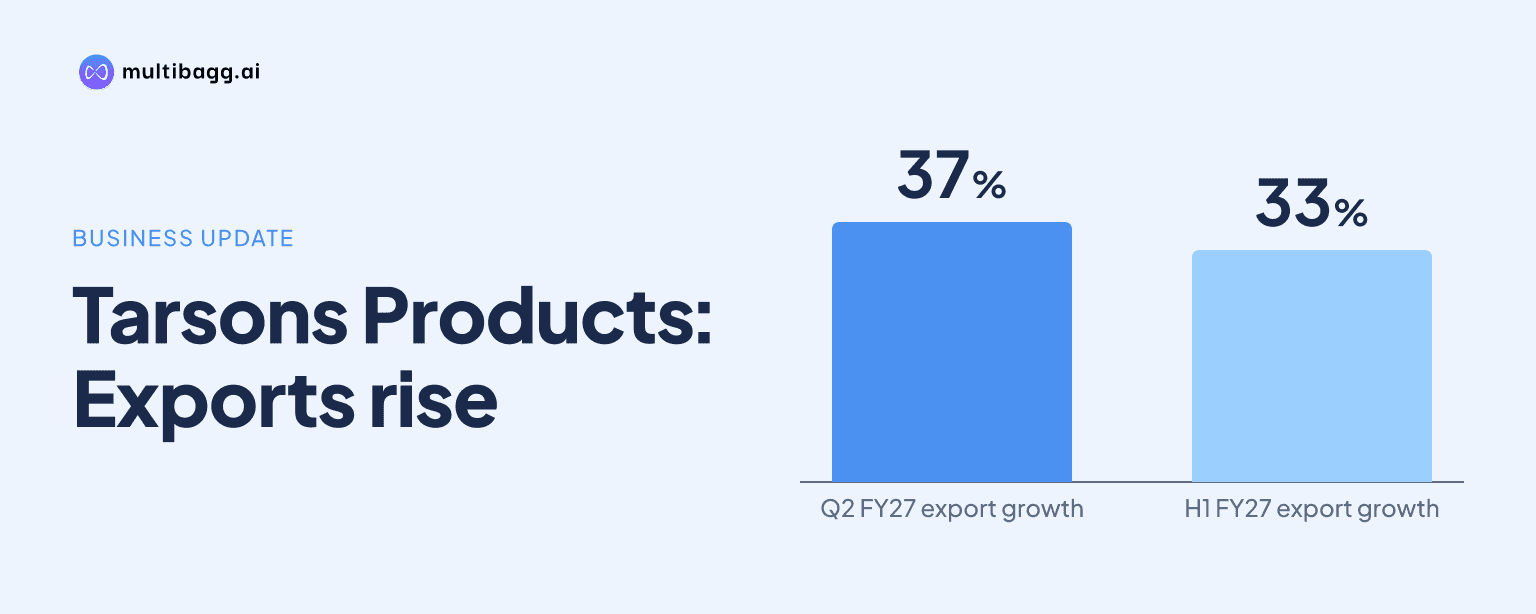
- Standalone export revenue rose 37% in Q2 FY27 and 33% in H1 FY27.
- Consolidated H1 FY27 operating cash flow increased to ₹53 crore from ₹44 crore a year earlier.
powered by IRIS
Tarsons Products Limited posted record Q2 FY27 revenue of ₹123.65 crore, up 20.8% year on year, while standalone export revenue rose 37%. The September 2026 quarter marked the company’s highest-ever quarterly revenue, although higher crude-linked raw-material costs moderated gross margins and the consolidated business reported a ₹0.34 crore net loss.
Know Tarsons Products inside out
Results, valuation, peers and who's buying, in one view.
What did Tarsons Products report in Q2 FY27?
Tarsons Products reported its highest-ever quarterly and half-yearly revenue for the periods ended September 30, 2026. Consolidated revenue for Q2 FY27 was ₹123.65 crore, an increase of 20.8% from a year earlier. Management said consolidated revenue growth was 21% on a rounded basis, while standalone revenue increased 25% year on year.
Standalone Q2 revenue crossed ₹100 crore for the first time in the company’s history. For the first half of FY27, consolidated revenue stood at ₹233.9 crore, up 21% year on year, while standalone revenue grew 23%. The performance followed a rebound in demand for laboratory plasticware, a core product category for Tarsons Products and an important input for India’s life-sciences sector.
How did export and domestic demand drive growth?
Export growth was the fastest-moving component of Tarsons Products’ standalone business in Q2 FY27, rising 37% from the year-earlier quarter. Management attributed the increase to a higher wallet share with key customers and restocking activity. Standalone export revenue also rose 33% during H1 FY27.
Domestic standalone revenue grew 19% in the quarter. Together, domestic and export growth lifted standalone revenue beyond ₹100 crore despite limited stated contribution from new facilities. The company’s call commentary pointed to stronger demand from pharmaceutical and healthcare-linked customers, alongside rising export enquiries.
The revenue mix matters because Tarsons Products supplies laboratory consumables used across research, diagnostics, pharmaceutical and healthcare applications. Higher volumes can support operating leverage, but the reported quarter also showed that sales growth does not fully insulate margins when polymer and other crude-linked input costs rise sharply.
Why did Tarsons Products' margins moderate despite revenue growth?
Tarsons Products’ gross margin moderated to about 67% in Q2 FY27 from the early-70% range because crude-linked raw-material prices rose by 30% to 50% from March 2026. On a standalone basis, gross profit increased 15% year on year to ₹67.4 crore from ₹58.6 crore, trailing the company’s 25% standalone revenue growth.
Management said volume growth, operating leverage and operational efficiencies partly offset the input-cost pressure. Consolidated gross profit rose 14.2% in Q2 FY27 and 14.7% in H1 FY27. Standalone EBITDA was ₹30.6 crore in the quarter, up 15.9% year on year, while consolidated EBITDA grew 13.3%.
The margin movement is significant for investors because the company’s products depend on plastic resins and other materials influenced by crude prices. The call identified the cost increase as the primary reason for gross-margin moderation, rather than a decline in customer demand. Tarsons Products did not disclose a specific timeline for raw-material costs to normalise.
Got a follow-up? Ask IRIS
What do cash flow and expansion plans show?
Tarsons Products generated higher operating cash flow in H1 FY27, indicating that revenue growth also translated into stronger cash generation. Standalone operating cash flow rose to ₹49 crore from ₹40 crore in H1 FY26, while consolidated operating cash flow increased to ₹53 crore from ₹44 crore.
The company is also progressing its capacity expansion at Amta and Panchla. New-capacity costs weighed on profitability during the period, according to the earnings-call summaries. These facilities remain relevant to the company’s ability to serve future volume demand, but management indicated that their current contribution to revenue was limited.
Supplies from Tarsons India to Nerbe have started. Management said these supplies should ramp up significantly by next year, making the relationship an operational development to monitor. The company did not provide a revenue figure or a quantified earnings contribution for the supply ramp-up.
How did Q2 FY27 results affect investors and operations?
Tarsons Products’ Q2 FY27 results showed strong top-line momentum but a weaker bottom line. The consolidated business posted a net loss of ₹0.34 crore, compared with a ₹3.32 crore profit in Q2 FY26. This outcome followed the reported raw-material cost pressure and expansion-related costs, even as EBITDA and operating cash flow increased.
For investors, the quarter provides two contrasting signals. Revenue, exports and cash flow improved, supporting the company’s demand narrative, while gross-margin moderation shows continued sensitivity to input costs. For customers and industry participants, the revenue record and ongoing capacity additions indicate that Tarsons Products is continuing to expand supply capabilities for laboratory and life-sciences applications.
Management’s reported sustainable-growth expectation was 15%, while the quarter’s reported revenue growth was higher. That comparison should be viewed alongside the company’s stated expectation that new facilities could contribute more meaningfully over time and that supplies to Nerbe are expected to build further next year.
Conclusion
Tarsons Products delivered record revenue in Q2 FY27, led by 25% standalone growth, 20.8% consolidated growth and a 37% increase in standalone exports. The results also highlighted the cost challenge facing the business: gross margin moved to about 67% as crude-linked raw-material prices increased, and consolidated net profit turned into a small loss.
The next key developments are the pace of supplies to Nerbe, the revenue contribution from the Amta and Panchla facilities, and any movement in crude-linked input costs. These factors will help determine whether the company can sustain sales growth while improving its margin and profit performance.