










UFlex film output rose 12.5% as utilisation hit 85.37%
Key highlights
- UFlex produced 135,778 MTPQ of packaging films in Q2 FY27, up 12.5% year on year.
- UFlex's packaging-film utilisation reached 85.37% in Q2 FY27, versus 75.9% in Q2 FY26.
- UFlex's Nigeria film output rose 37.9% year on year to 9,644 MTPQ in Q2 FY27.
- UFlex's India film output rose 15.8% sequentially to 35,372 MTPQ in Q2 FY27.
powered by IRIS
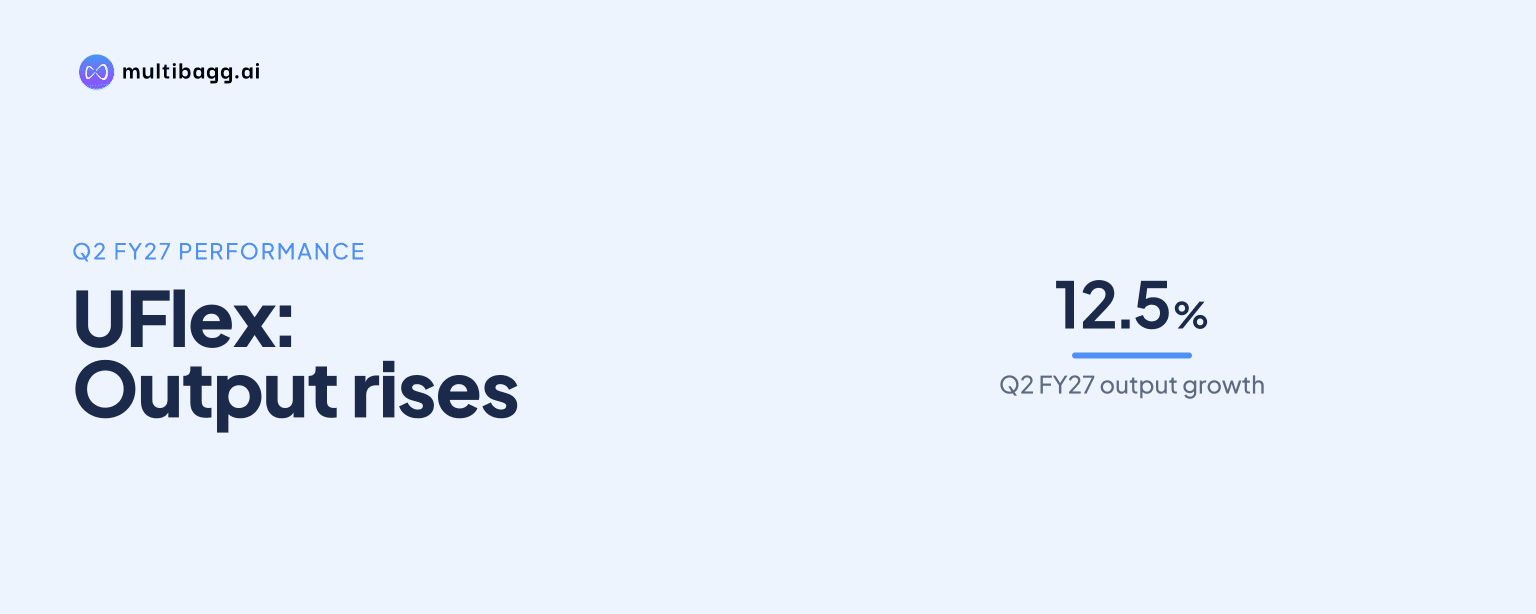
UFlex raised packaging-film production by 12.5% year on year to 135,778 metric tonnes per quarter in Q2 FY27, taking network utilisation to 85.37% from 75.9% in Q2 FY26. Nigeria, Egypt, Poland and Mexico delivered the largest annual percentage output increases, while total production was 0.1% lower sequentially.
Know Uflex inside out
Results, valuation, peers and who's buying, in one view.
How much did UFlex packaging-film output increase in Q2 FY27?
UFlex produced 135,778 metric tonnes per quarter (MTPQ) of packaging films in Q2 FY27, compared with 120,644 MTPQ in Q2 FY26. Capacity was 159,040 MTPQ, and utilisation rose by 9.47 percentage points to 85.37% from 75.9% a year earlier.
The annual gain contrasted with a virtually unchanged sequential result. Q2 FY27 output was 95 tonnes below Q1 FY27 production of 135,873 MTPQ, while utilisation moved from 85.43% to 85.37%. The figures show that the network's higher year-on-year output level was already in place in Q1 FY27 rather than being created through further aggregate growth in Q2.
UFlex reported consolidated sales volume of 163,532 metric tonnes in Q2 FY27, up 1.5% year on year. Packaging films accounted for 78.9% of that sales volume and grew 3.0%, whereas packaging solutions represented 21.1% and declined 3.9%; production is a plant-output measure, while the sales data cover the consolidated volume mix.
Which UFlex plants led year-on-year production growth?
UFlex's Nigeria plant recorded the fastest annual production increase, rising 37.9% to 9,644 MTPQ in Q2 FY27 from 6,995 MTPQ in Q2 FY26. Egypt rose 29.0% to 26,043 MTPQ, Poland rose 24.4% to 14,015 MTPQ, and Mexico rose 22.4% to 17,102 MTPQ.
India also grew output by 8.1% to 35,372 MTPQ and remained UFlex's biggest single film-production base. India represented 26% of Q2 FY27 output, Egypt represented 19%, and Mexico represented 13%; Egypt and Mexico increased their shares from 17% and 12%, respectively, in Q2 FY26.
The gains were not shared by every location. Hungary's output increased 11.5% to 10,633 MTPQ and US output rose 1.6% to 7,889 MTPQ, but Dubai declined 17.2% to 5,642 MTPQ and the Commonwealth of Independent States (CIS) declined 17.1% to 9,438 MTPQ. Growth in the four leading locations therefore outweighed the reductions in Dubai and CIS.
How did UFlex production change from Q1 FY27?
UFlex's largest sequential increase came from India, where output grew 15.8% from 30,548 MTPQ in Q1 FY27 to 35,372 MTPQ in Q2 FY27. Mexico increased 10.4% to 17,102 MTPQ and Dubai increased 9.6% to 5,642 MTPQ, while Nigeria was broadly unchanged with a 0.8% increase to 9,644 MTPQ.
These gains were offset by reductions elsewhere. Egypt declined 11.7% from 29,491 MTPQ, CIS declined 9.5% from 10,426 MTPQ, Poland fell 9.3% from 15,453 MTPQ, Hungary fell 8.6% from 11,637 MTPQ, and the US declined 2.8% from 8,117 MTPQ.
The production mix consequently shifted towards India and Mexico. India's contribution rose to 26% in Q2 FY27 from 22% in Q1 FY27, while Mexico's increased to 13% from 11%; Egypt's fell to 19% from 22%, Poland's to 10% from 11%, and Hungary's to 8% from 9%.
Got a follow-up? Ask IRIS
What do UFlex utilisation levels show by geography?
UFlex's highest Q2 FY27 utilisation rates were 105.2% in the US and 101.3% in Hungary, followed by 91.4% in Egypt, 87.7% in Mexico, 86.2% in India and 85.7% in Nigeria. The presentation shows output above stated quarterly capacity in the US, at 7,889 MTPQ against 7,500 MTPQ, and Hungary, at 10,633 MTPQ against 10,500 MTPQ.
Dubai had the lowest utilisation among the listed plants at 56.4%, followed by Poland at 74.7% and CIS at 78.7%. Dubai's rate was below 68.2% in Q2 FY26, while Poland improved from 60.1% and CIS declined from 94.9%, showing different operating changes across the network.
UFlex states that technological enhancements increased the new packaging-film capacity of its Indian plants to 164,160 metric tonnes per annum (MTPA) from 155,000 MTPA. It also says CIS capacity became 48,000 MTPA after an 18,000-MTPA cast polypropylene line was commissioned, while Hungary capacity was upgraded to 45,000 MTPA from 42,000 MTPA.
How does Q2 FY27 compare with UFlex's recent annual production?
UFlex produced 492,779 tonnes of packaging films in FY26, down 4.3% from 514,758 tonnes in FY25. Annual utilisation declined to 77.5% in FY26 from 83.1% in FY25, placing Q2 FY27's 85.37% utilisation above both the FY26 average and the FY25 annual level.
Several major plants reported lower FY26 output than FY25, including India at 118,671 tonnes versus 121,842 tonnes, Egypt at 95,455 tonnes versus 104,368 tonnes, and Poland at 47,933 tonnes versus 52,637 tonnes. Mexico was an exception, rising to 58,238 tonnes from 55,487 tonnes, while CIS increased to 43,610 tonnes from 38,201 tonnes.
UFlex incurred capital expenditure of Rs 568.9 crore in Q2 FY27, following Rs 478.2 crore in Q1 FY27, for Rs 1,047.1 crore in H1 FY27. Its Dharwad brownfield biaxially oriented polypropylene line has planned capacity of 54,000 MTPA and is scheduled for commissioning in FY27-28, according to the presentation.
Conclusion
UFlex's Q2 FY27 data show a film network producing 135,778 MTPQ at 85.37% utilisation, materially above the 75.9% recorded a year earlier. Nigeria, Egypt, Poland and Mexico led annual output growth, while the marginal sequential decline reflected gains in India, Mexico and Dubai being offset by lower production at several other plants.
The next disclosed film-capacity milestone is the 54,000-MTPA Dharwad BOPP line scheduled for FY27-28. UFlex also plans to commission its greenfield aseptic project in Ain Sokhna, Egypt, in H2 FY27, with capacity for 12 billion carton packs; the presentation does not state a commissioning date for Dharwad within that fiscal range.