










UFlex net debt rose while leverage fell to 3.42 times in FY27
Key highlights
- UFlex reported net debt of Rs 9,039 crore at September 30, 2026, versus Rs 8,621.8 crore at March 2026.
- UFlex’s net debt to annualised normalized EBITDA declined to 3.42 times from 4.51 times at March 2026.
- H1 FY27 normalized EBITDA increased 85.7% year on year to Rs 1,596.1 crore.
- Term loans represented Rs 8,163 crore, or 76%, of UFlex’s Rs 10,722 crore gross debt.
powered by IRIS
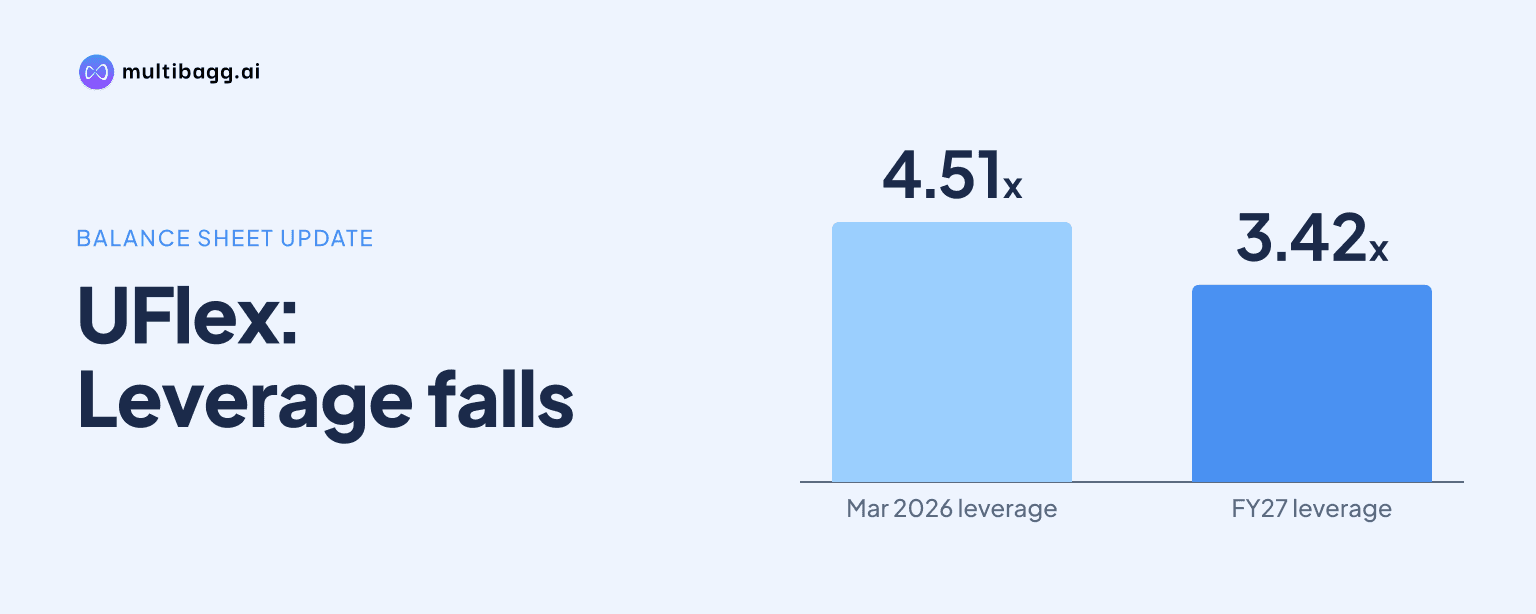
UFlex Limited reported net debt of Rs 9,039 crore at September 30, 2026, while net debt to annualised normalized earnings before interest, tax, depreciation and amortisation (EBITDA) fell to 3.42 times from 4.51 times at March 31, 2026, as H1 FY27 normalized EBITDA rose 85.7% year on year.
Know Uflex inside out
Results, valuation, peers and who's buying, in one view.
Why did UFlex’s net debt rise by September 2026?
UFlex’s net debt rose because gross debt increased faster than the cash and specified balances deducted in its net-debt calculation. Net debt was Rs 9,039 crore at September 2026, up Rs 417.2 crore from Rs 8,621.8 crore at March 2026 and Rs 451.5 crore from Rs 8,587.5 crore at June 2026. It was also Rs 1,285.7 crore above Rs 7,753.3 crore at September 2025.
Gross debt reached Rs 10,722.1 crore at September 2026, compared with Rs 9,852.6 crore at March 2026 and Rs 10,439 crore at June 2026. In the debt profile, long-term debt rose to Rs 8,162.6 crore from Rs 7,355.6 crore over the six months, while working-capital and short-term debt increased to Rs 2,559.5 crore from Rs 2,497 crore.
The consolidated balance sheet separately reported Rs 6,612.1 crore of non-current borrowings and Rs 4,110 crore of short-term borrowings at September 30, 2026. Cash and cash equivalents on that balance sheet rose to Rs 1,365.4 crore from Rs 984.4 crore at March 31, 2026. For its debt-profile calculation, UFlex says cash and cash equivalents also include bank balances and certain non-current financial assets, including fixed deposits, margin-money deposits and debt-service-coverage-account balances.
How did UFlex reduce leverage while net debt increased?
UFlex reduced its reported leverage ratio because annualised normalized EBITDA increased more quickly than net debt. Net debt to normalized EBITDA fell to 3.42 times at September 2026 from 4.51 times at March 2026, 3.77 times at June 2026 and 4.72 times at December 2025. The presentation defines the metric using annualised normalized EBITDA.
H1 FY27 normalized EBITDA was Rs 1,596.1 crore, up 85.7% from Rs 859.3 crore in H1 FY26. The normalized EBITDA margin expanded by 450 basis points to 15.5% from 11.0%, while H1 revenue rose 31.9% to Rs 10,266.6 crore from Rs 7,782.8 crore. A basis point is one-hundredth of a percentage point.
The measure based on reported EBITDA moved in the same direction. Net debt to EBITDA was 3.33 times at September 2026, against 4.35 times at March 2026 and 4.32 times a year earlier. H1 FY27 EBITDA was Rs 1,632.4 crore, 81.9% above Rs 897.5 crore in H1 FY26, while the EBITDA margin increased to 15.9% from 11.5%.
Quarterly earnings nevertheless declined sequentially. Q2 FY27 normalized EBITDA was Rs 758.8 crore, down 9.4% from Rs 837.3 crore in Q1 FY27, although it was 94.8% above Rs 389.5 crore in Q2 FY26. Q2 FY27 revenue of Rs 4,820.9 crore was 10.2% below Q1 FY27 but 25.8% above the year-earlier quarter.
What is UFlex’s debt mix by geography and type?
UFlex’s Rs 10,722 crore gross debt at September 2026 was split between Rs 5,660 crore overseas and Rs 5,062 crore in India. Overseas borrowings represented 53% of gross debt, compared with 47% for India. The presentation classifies Rs 4,246 crore of overseas debt as term loans and Rs 1,414 crore as working-capital and short-term facilities.
Term loans accounted for Rs 8,163 crore, or 76%, of gross debt, while working-capital and short-term borrowings accounted for Rs 2,559 crore, or 24%. Indian term loans were Rs 3,916 crore and Indian working-capital and short-term borrowings were Rs 1,146 crore. The small differences from the quarterly debt table reflect presentation rounding.
The debt balance has risen over several reported fiscal years. Gross debt was Rs 8,120 crore in FY25 and Rs 9,850 crore in FY26, before reaching Rs 10,722 crore in September 2026. Net debt increased from Rs 6,840 crore in FY25 to Rs 8,620 crore in FY26 and Rs 9,039 crore in September 2026.
UFlex listed CRISIL AA-/Stable/CRISIL A1+ ratings for long-term and short-term borrowings as of May 2025. It also listed Ind AA-/Stable/IND A1+ ratings as of September 2025. These are the latest rating dates stated in the presentation, rather than a rating update for September 2026.
Got a follow-up? Ask IRIS
What operating and investment figures accompany UFlex’s debt position?
UFlex reported capital expenditure of Rs 1,047.1 crore in H1 FY27, following Rs 2,042.6 crore in FY26 and Rs 1,725.8 crore in FY25. Property, plant and equipment increased to Rs 9,520 crore at September 2026 from Rs 8,937.9 crore at March 2026, while capital work-in-progress declined to Rs 2,036.2 crore from Rs 2,169.2 crore.
Total assets increased by Rs 2,578.7 crore over the six months to Rs 24,750.1 crore at September 2026. Current assets rose by Rs 1,920.2 crore to Rs 10,908.4 crore, including inventories of Rs 3,164.7 crore, up from Rs 2,408.3 crore, and trade receivables of Rs 4,397.9 crore, up from Rs 3,860.8 crore.
Revenue mix also changed in Q2 FY27. Packaging films, including polyethylene terephthalate chips, represented 67.0% of revenue, compared with 63.0% in Q2 FY26, while packaging represented 23.2%, down from 27.9%. Q2 FY27 consolidated revenue was Rs 4,820.9 crore, compared with Rs 3,832 crore in Q2 FY26.
Packaging-film sales volume in H1 FY27 was 265,211 metric tonnes, 4.0% above 255,032 metric tonnes in H1 FY26. Middle East and Africa volume rose 11.6% to 75,630 metric tonnes and Americas volume increased 12.0% to 59,267 metric tonnes. India volume fell 5.2% to 62,180 metric tonnes, while Europe declined 0.9% to 68,134 metric tonnes.
What should readers monitor in UFlex’s debt disclosures?
UFlex’s next debt disclosures will show whether the earnings-led reduction in leverage continues as debt balances change. Between June and September 2026, net debt increased by Rs 451.5 crore while net debt to normalized EBITDA declined by 0.35 times. Finance costs were Rs 448.9 crore in H1 FY27, up 16.0% from Rs 386.9 crore in H1 FY26.
Working-capital balances are also relevant to the debt profile. Inventory rose by Rs 756.4 crore during the six months to September 2026, while trade payables increased by Rs 932.1 crore to Rs 3,391.6 crore. Current liabilities totalled Rs 8,591.9 crore at September 2026, compared with Rs 7,415.4 crore at March 2026.
The presentation does not disclose a net-debt reduction target or a future leverage target. It does, however, disclose Rs 1,047.1 crore of H1 FY27 capital expenditure and Rs 2,036.2 crore of capital work-in-progress at September 2026, providing reported figures against which later borrowing, cash and earnings movements can be assessed.
Conclusion
UFlex entered September 2026 with a higher debt balance, as gross debt reached Rs 10,722.1 crore and net debt reached Rs 9,039 crore. However, the net-debt-to-annualised-normalized-EBITDA ratio declined to 3.42 times because H1 FY27 normalized EBITDA rose 85.7% to Rs 1,596.1 crore. Term loans comprised 76% of gross debt, and overseas borrowings represented 53%.
The next results should be assessed against UFlex’s disclosed Rs 1,047.1 crore H1 FY27 capital expenditure, Rs 2,036.2 crore capital work-in-progress and rising working-capital balances. Since the presentation gives no future leverage or debt-reduction target, subsequent changes in gross debt, cash balances, finance costs and annualised EBITDA will determine whether the September 2026 ratio improvement persists.