










UFlex Q2 normalized EBITDA rises 94.8% as margin reaches 15.6%
Key highlights
- UFlex reported Q2 FY27 normalized EBITDA of Rs 758.8 crore, up 94.8% year on year.
- Q2 FY27 normalized EBITDA margin rose 550 basis points year on year to 15.6%.
- Total income rose 26.1% to Rs 4,869.4 crore while packaging sales volume grew 1.5% to 163,532 metric tonnes.
- H1 FY27 normalized EBITDA reached Rs 1,596.1 crore, up 85.7% year on year.
powered by IRIS
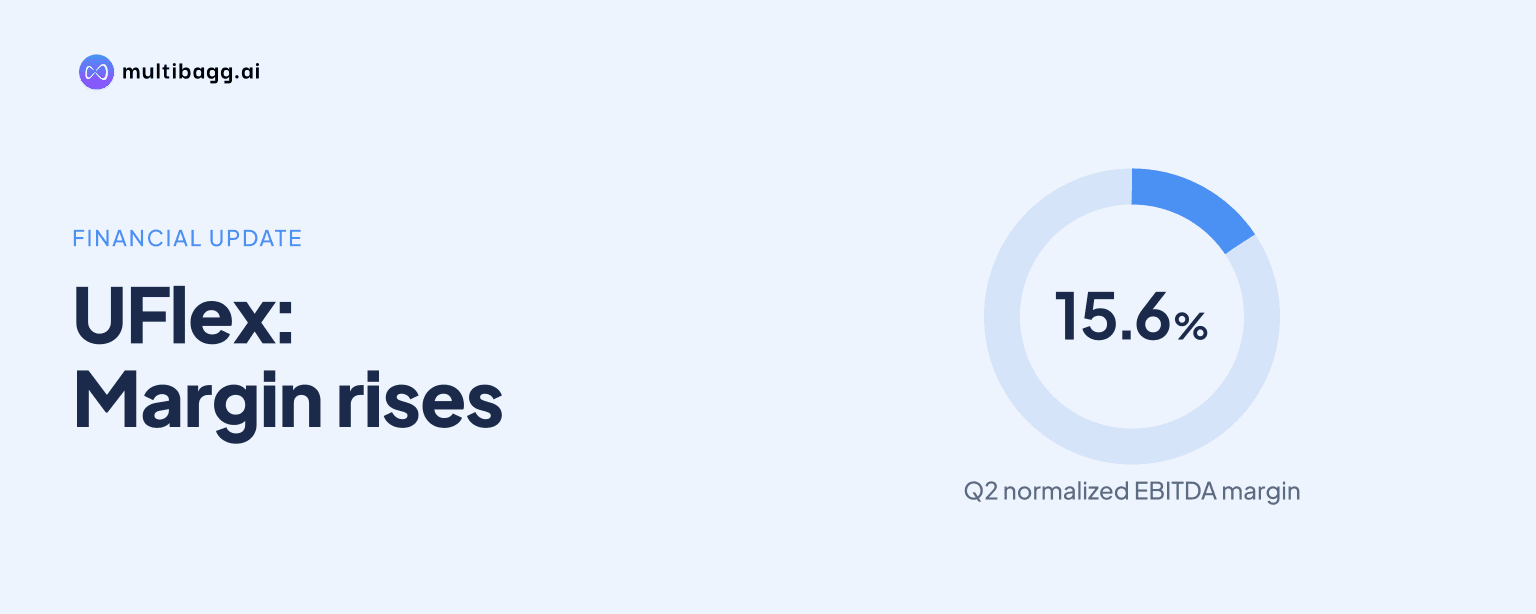
UFlex Limited reported normalized EBITDA of Rs 758.8 crore in Q2 FY27, up 94.8% year on year, while normalized EBITDA margin rose 550 basis points to 15.6% despite consolidated sales volume increasing only 1.5% to 163,532 metric tonnes. Management attributed the improvement to higher realisations, product mix and spread expansion.
Know Uflex inside out
Results, valuation, peers and who's buying, in one view.
Why did UFlex’s Q2 FY27 normalized EBITDA rise 94.8%?
UFlex’s normalized EBITDA rose because total income increased 26.1% year on year to Rs 4,869.4 crore in Q2 FY27 while expenditure rose 20.8% to Rs 4,156.8 crore. This difference lifted normalized EBITDA from Rs 389.5 crore in Q2 FY26 to Rs 758.8 crore, and increased the margin from 10.1% to 15.6%.
Management said higher realisations, a better product mix and spread expansion led the margin recovery. It identified Egypt, India, Mexico, Nigeria and Hungary as the major contributors to incremental EBITDA, while Packaging Films and PET Chips supplied 83% of the Rs 1,008.4 crore incremental revenue in the quarter.
Normalized EBITDA differs from reported EBITDA because UFlex adjusts for foreign-exchange and derivative movements. UFlex reported EBITDA of Rs 712.6 crore, up 70.2% year on year, with a 14.6% margin; normalized EBITDA included a Rs 46.2 crore foreign-exchange and derivative loss adjustment in Q2 FY27.
How did revenue growth compare with UFlex’s sales volumes?
UFlex’s Q2 FY27 total income rose 26.1%, substantially faster than the 1.5% increase in total packaging sales volume, showing that the revenue increase was not principally driven by tonnage. Total sales volume reached 163,532 metric tonnes, with Packaging Films representing 78.9% and Packaging Solutions representing 21.1%.
Packaging Films volume increased 3.0% year on year, whereas Packaging Solutions volume declined 3.9%. Within films, Middle East and Africa volume grew 8.2%, the Americas rose 5.9%, and India increased 0.5% year on year, while Q2 film volume across all regions fell 5.3% sequentially from Q1 FY27.
The revenue mix also shifted toward Packaging Films including PET chips, which represented 67.0% of Q2 revenue versus 63.0% a year earlier. Packaging’s share fell to 23.2% from 27.9%, even as its revenue grew 5.2%, while Engineering revenue rose 36.2% and Other Value-Added Products, or VAP, revenue increased 28.2%.
Which operations and products supported the earnings recovery?
UFlex’s Packaging Films production increased 12.5% year on year to 135,778 metric tonnes in Q2 FY27, lifting consolidated film-capacity utilization to 85.4% from 75.9% in Q2 FY26. Mexico production rose 22.4%, Egypt rose 29.0%, Nigeria rose 37.9%, and Poland rose 24.4%, although total production was broadly unchanged sequentially.
India’s film production rose 8.1% year on year to 35,372 metric tonnes, and its utilization reached 86.2%, compared with 79.7% in Q2 FY26. Egypt produced 26,043 metric tonnes at 91.4% utilization, while Mexico produced 17,102 metric tonnes at 87.7%; the presentation identifies both countries among the major sources of incremental EBITDA.
Virgin polyethylene terephthalate, or PET, chips also supported sales growth through higher realisations for solid-state polymerisation, or SSP-grade bottle-grade, chips. UFlex said West Asia disruption created monoethylene glycol, or MEG, shortages that increased input costs and constrained finished-goods availability, while integrated Panipat operations and domestic purified terephthalic acid and MEG sourcing from Indian Oil Corporation supported feedstock security.
Got a follow-up? Ask IRIS
What happened to profit, debt and investment in Q2 FY27?
UFlex’s normalized profit after tax and non-controlling interest rose 682.8% year on year to Rs 210.6 crore in Q2 FY27, producing a 4.3% margin versus 0.7% a year earlier. Reported profit after tax before non-controlling interest was Rs 215.0 crore, up 609.7%, after depreciation and amortization of Rs 221.5 crore and finance costs of Rs 232.7 crore.
The quarter’s profit increase was larger than the EBITDA gain in percentage terms because profit before tax rose from Rs 41.2 crore to Rs 258.5 crore. Finance costs increased 23.7% year on year, while depreciation and amortization increased 16.9%, alongside the group’s asset base and continuing investment programme.
UFlex incurred capital expenditure of Rs 568.9 crore in Q2 FY27, following Rs 478.2 crore in Q1 FY27, taking first-half capital expenditure to Rs 1,047.1 crore. Net debt stood at Rs 9,039 crore at the end of Q2 FY27, while the September 30, 2026 balance sheet showed long-term borrowings of Rs 6,612.1 crore and short-term borrowings of Rs 4,110 crore.
What does UFlex’s first-half FY27 performance show?
UFlex’s H1 FY27 normalized EBITDA rose 85.7% year on year to Rs 1,596.1 crore, with a 15.5% margin, compared with Rs 859.3 crore and an 11.0% margin in H1 FY26. H1 total income increased 31.9% to Rs 10,266.6 crore, while packaging sales volume increased 1.6% to 337,003 metric tonnes.
The first-half comparison also shows a larger international revenue contribution than in Q2. International revenue accounted for 58% of H1 FY27 total income, compared with 55% in Q2 FY27, while international Packaging Films volume represented 60.3% of total packaging sales volume in H1.
H1 Packaging Films sales volume rose 4.0%, led by 12.0% growth in the Americas and 11.6% growth in Middle East and Africa, while India declined 5.2%. This differed from Q2, when India’s films volume rose 0.5% year on year and Middle East and Africa delivered the fastest regional growth at 8.2%.
Normalized EBITDA in H1 FY27 was 83.6% of FY26’s full-year Rs 1,909.7 crore, based on UFlex’s historical financial table. H1 normalized profit after tax and non-controlling interest reached Rs 634.0 crore, exceeding FY26’s full-year normalized profit after tax of Rs 336.2 crore, though the presentation does not provide a full-year FY27 forecast figure.
Conclusion
UFlex’s Q2 FY27 earnings recovery was primarily a margin and realisation story rather than a volume-led expansion. Total income rose 26.1% while sales volume grew 1.5%, and the resulting 550-basis-point normalized EBITDA margin expansion lifted normalized EBITDA 94.8% to Rs 758.8 crore. Higher Packaging Films and PET chip contribution, production gains in several overseas operations, and improved mix were the mechanisms management cited.
The next disclosed milestones are capacity projects: the Noida Sector 155 recycling plant was commissioned on May 1, 2026, the Egypt aseptic-packaging project is scheduled for H2 FY27, and the Dharwad brownfield BOPP, or biaxially oriented polypropylene, line is scheduled for FY27-28. Management expects ramp-up of recently commissioned facilities, the Mexico WPP bags facility, the Egypt project, higher-value-added products and operational efficiencies to support FY27 growth and realisations; input-cost volatility, aseptic import competition and West Asia disruption remain unresolved matters disclosed in the presentation.