










UFlex H1 film growth came from MEA and Americas
Key highlights
- UFlex packaging-film sales volume rose 4.0% year on year to 265,211 MT in H1 FY27.
- UFlex MEA film volume increased 11.6% to 75,630 MT in H1 FY27.
- UFlex Americas film volume rose 12.0% to 59,267 MT in H1 FY27.
- UFlex India and Europe film volumes declined 5.2% and 0.9%, respectively, in H1 FY27.
powered by IRIS
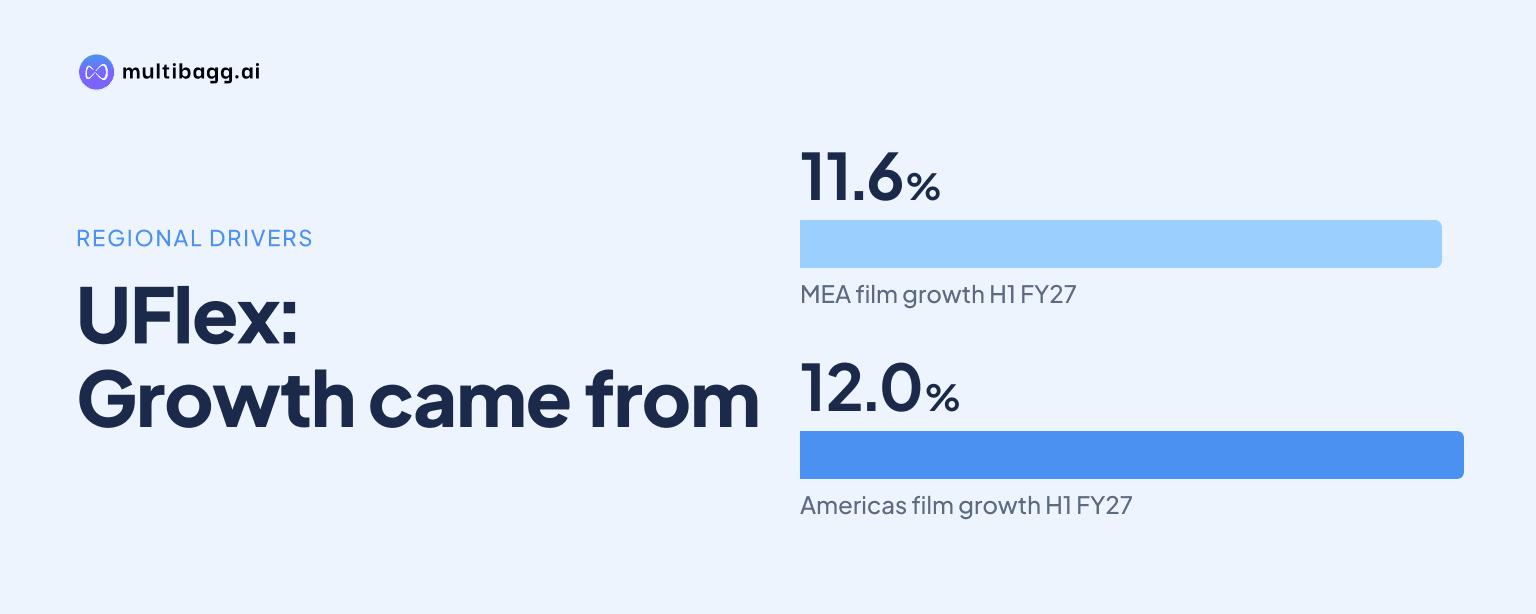
UFlex Limited increased packaging-film sales volume 4.0% year on year to 265,211 metric tonnes (MT) in H1 FY27, with Middle East and Africa (MEA) up 11.6% and the Americas up 12.0%. Those regions added 14,226 MT, more than offsetting volume declines of 3,407 MT in India and 640 MT in Europe.
Know Uflex inside out
Results, valuation, peers and who's buying, in one view.
What drove UFlex packaging-film growth in H1 FY27?
UFlex’s H1 FY27 packaging-film growth came from MEA and the Americas, not from India or Europe. Total packaging-film sales rose by 10,179 MT from 255,032 MT in H1 FY26 to 265,211 MT in H1 FY27. MEA volume increased by 7,854 MT to 75,630 MT, while the Americas added 6,372 MT to reach 59,267 MT.
The contribution from those two regions exceeded the group’s net increase because India and Europe reported lower sales. India volume fell 5.2% to 62,180 MT from 65,587 MT, and Europe volume declined 0.9% to 68,134 MT from 68,774 MT. MEA was UFlex’s largest film-sales region in H1 FY27, followed by Europe, India and the Americas.
UFlex reported that packaging films accounted for 78.7% of consolidated sales volume of 337,003 MT in H1 FY27, compared with 76.7% in FY26. International films represented 60.3% of total sales volume in H1 FY27, while domestic films represented 18.4%; the comparable FY26 shares were 58.6% and 18.1%, respectively.
Why did UFlex MEA film volume rise in H1 FY27?
UFlex attributed MEA’s 11.6% H1 FY27 volume growth to a demand recovery after inventory movements and a preference for domestic sourcing during the West Asia crisis. The presentation says customers built inventory proactively in Q1 FY27, destocked in July and then saw demand recover. It identifies Egypt and Turkey as beneficiaries of regional volume growth.
MEA film sales reached 36,144 MT in Q2 FY27, up 8.2% year on year from 33,401 MT in Q2 FY26, although down 8.5% from 39,486 MT in Q1 FY27. This quarterly pattern means the region’s H1 expansion was supported by both the Q1 inventory build-up and demand after the July destocking phase.
Egypt’s packaging-film production was 26,043 MT in Q2 FY27, 29.0% above 20,184 MT in Q2 FY26, despite being 11.7% below 29,491 MT in Q1 FY27. Egypt operated at 91.4% capacity utilisation in Q2 FY27, against 70.8% a year earlier. Nigeria produced 9,644 MT, a 37.9% year-on-year increase, at 85.7% utilisation.
UFlex also has an aseptic packaging project at Ain Sokhna, Egypt, with annual capacity of 12 billion carton packs and a planned capital expenditure of Rs 1,209.3 crore. The company had incurred Rs 1,057.8 crore by Q2 FY27 and listed commissioning in H2 FY27, but the presentation does not state that the project will add packaging-film capacity.
How did UFlex Americas volume grow despite softer US demand?
UFlex’s Americas packaging-film volume rose 12.0% year on year to 59,267 MT in H1 FY27, the fastest growth among the four reported regions. The presentation links steady UFlex volume growth in the United States to localized sourcing, supported by a US government push for nearshoring and disruptions to West Asia transit routes.
This company performance occurred while the presentation described a constrained US consumer packaged goods market in Q2 FY27. US food and beverage volumes declined 0.3% year on year and non-food consumer packaged goods volumes declined 1.9%. UFlex’s Q2 Americas film volume nevertheless rose 5.9% year on year to 27,543 MT from 26,019 MT.
The quarterly outcome also included a sequential reduction. Americas film sales fell 13.2% from 31,724 MT in Q1 FY27 to 27,543 MT in Q2 FY27. Mexico’s production increased 10.4% sequentially to 17,102 MT and 22.4% year on year, with utilisation of 87.7%, while US production was 7,889 MT at 105.2% utilisation.
UFlex’s Americas production and sales data measure different activities and do not establish a direct plant-to-market link. Still, Mexico and the USA together produced 24,991 MT in Q2 FY27, compared with 21,731 MT in Q2 FY26, while Americas film sales were 27,543 MT in the quarter.
Got a follow-up? Ask IRIS
What happened to UFlex India and Europe film sales?
UFlex India packaging-film sales declined 5.2% year on year in H1 FY27 to 62,180 MT, but its Q2 volume recovered from the preceding quarter. India sold 32,857 MT in Q2 FY27, up 12.1% from 29,323 MT in Q1 FY27 and 0.5% from 32,691 MT in Q2 FY26.
UFlex said packaging-film demand in India improved in Q2 FY27 as customers replenished inventory and imports declined. It said Q1 purchase deferrals followed West Asia crisis-related price increases. India fast-moving consumer goods sales volume grew 3.6% year on year in the September quarter, with rural volume growth of 3.6% marginally above urban growth of 3.5%.
Europe’s H1 packaging-film volume fell 0.9% to 68,134 MT, and Q2 volume declined 2.0% year on year to 32,481 MT. UFlex said Europe sales grew 31% year on year in Q2 FY27 despite a softer local market affected by summer holidays and heightened import competition. The presentation provides no regional revenue figure to reconcile that sales-value statement with the reported film-volume decline.
European production data were mixed in Q2 FY27. Poland produced 14,015 MT, up 24.4% year on year but down 9.3% sequentially, while Hungary produced 10,633 MT, up 11.5% year on year but down 8.6% from Q1 FY27. CIS production declined 17.1% year on year to 9,438 MT.
How did film growth affect UFlex’s H1 FY27 results?
UFlex’s 4.0% film-volume gain occurred alongside a 1.6% increase in total sales volume to 337,003 MT in H1 FY27. Packaging Solutions volume fell 6.3%, while films rose to 78.7% of group sales volume. The change shows that films, rather than Packaging Solutions, accounted for the increase in consolidated volume.
Total income rose 31.9% year on year to Rs 10,266.6 crore in H1 FY27. Normalized earnings before interest, tax, depreciation and amortisation (EBITDA) rose 85.7% to Rs 1,596.1 crore, and normalized EBITDA margin increased 450 basis points to 15.5%. Net profit after non-controlling interest rose 646.5% to Rs 634 crore.
International revenue accounted for 58% of H1 FY27 revenue and domestic revenue for 42%. UFlex reported H1 FY27 capital expenditure of Rs 1,047.1 crore, including the Egypt aseptic project, a brownfield biaxially oriented polypropylene line at Dharwad, India, and a recycling project at Noida Sector 155 commissioned on May 1, 2026.
Conclusion
UFlex’s H1 FY27 film-volume growth was geographically concentrated. MEA and the Americas generated combined volume growth that exceeded the group’s 10,179 MT net increase, compensating for lower sales in India and Europe. The result also raised films’ share of consolidated volume to 78.7% as Packaging Solutions volume declined 6.3%.
What to watch next is whether MEA demand remains supported after inventory normalisation, whether localized sourcing continues to support Americas volumes, and whether India’s Q2 recovery extends into later periods. Management has listed H2 FY27 commissioning for the Egypt aseptic project and FY27-28 for the Dharwad BOPP line, while also citing import competition, raw-material availability and geopolitical disruptions as relevant operating factors.