

Earnings Call/Transcript
Jindal Supreme Earnings Call Transcript
Jindal Supreme (India) Limited filed the transcript of its Q2 and H1 FY27 earnings call held on 17 November 2026.





IRIS
Multibagg AI is an AI powered stock research and analysis platform. We provide data, information, content, and analytics for publicly traded Indian companies listed on NSE and BSE. AI can make mistakes, check important information.
Prices might be delayed by a few minutes.
Join our Exclusive Community


Join our Exclusive Community
Made with 💙 in India. © Finsky Technologies Pvt Ltd. 2026


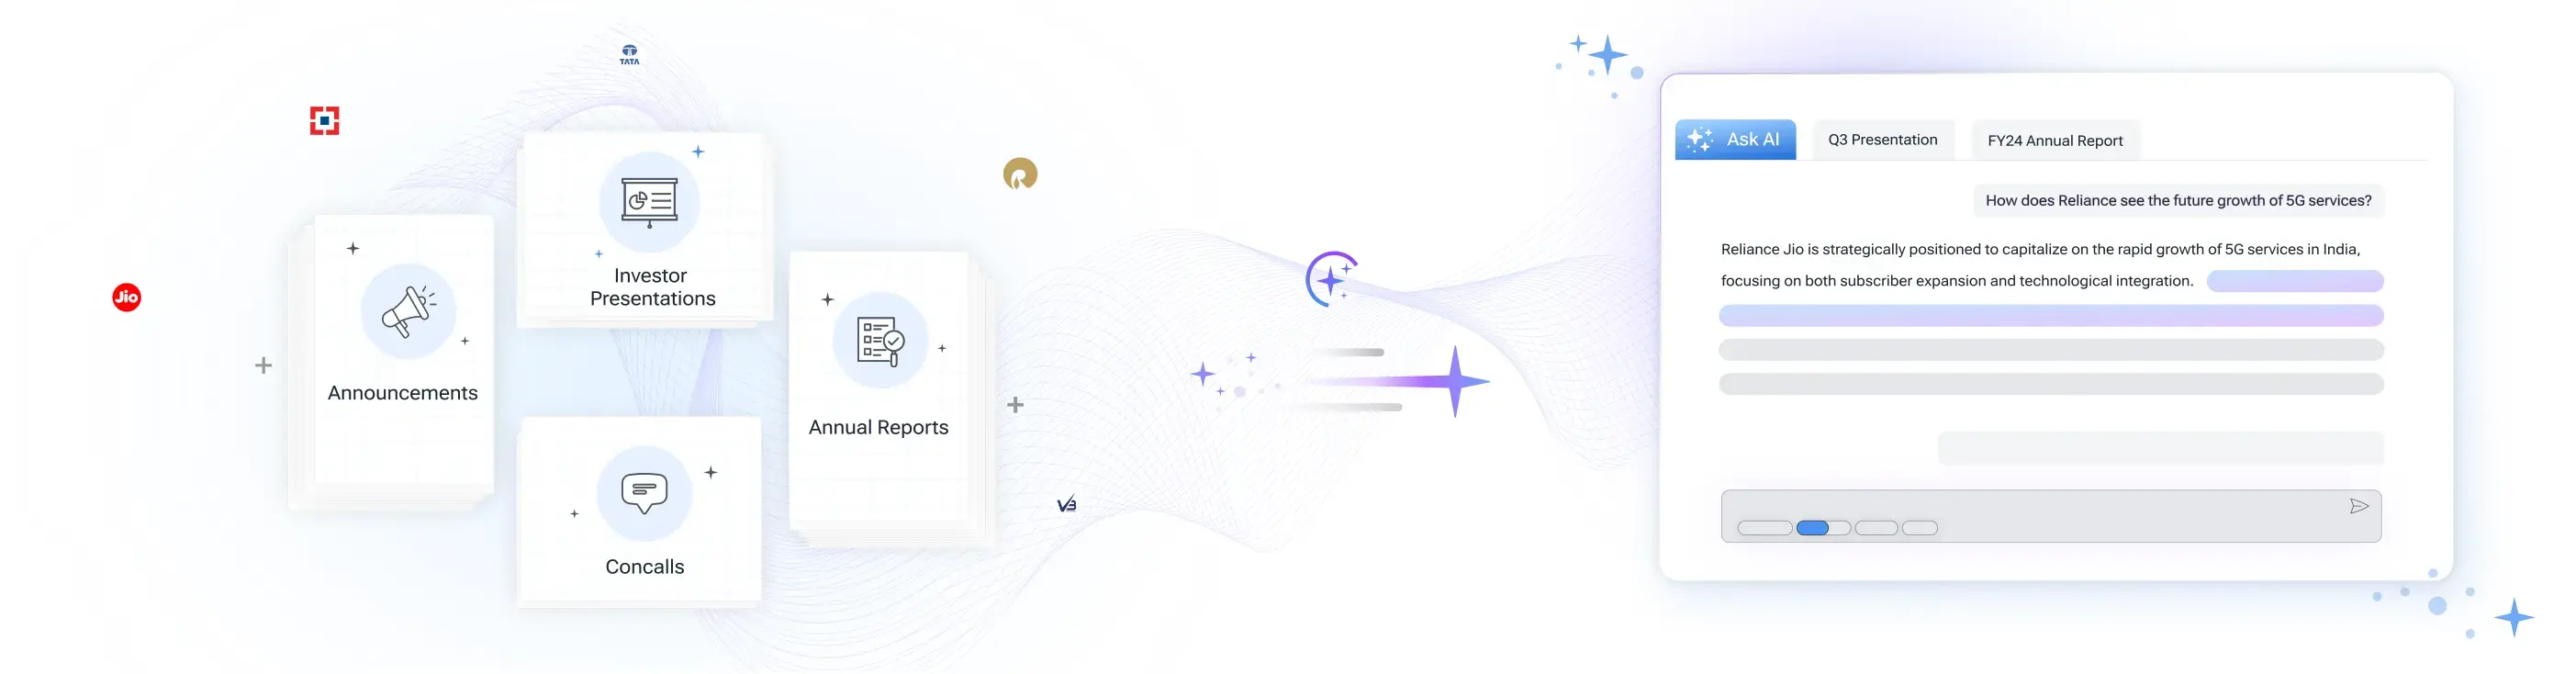
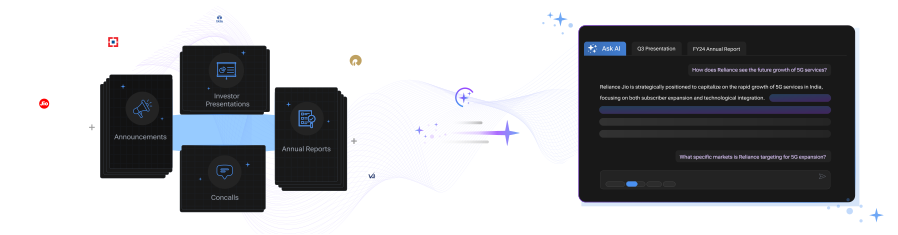
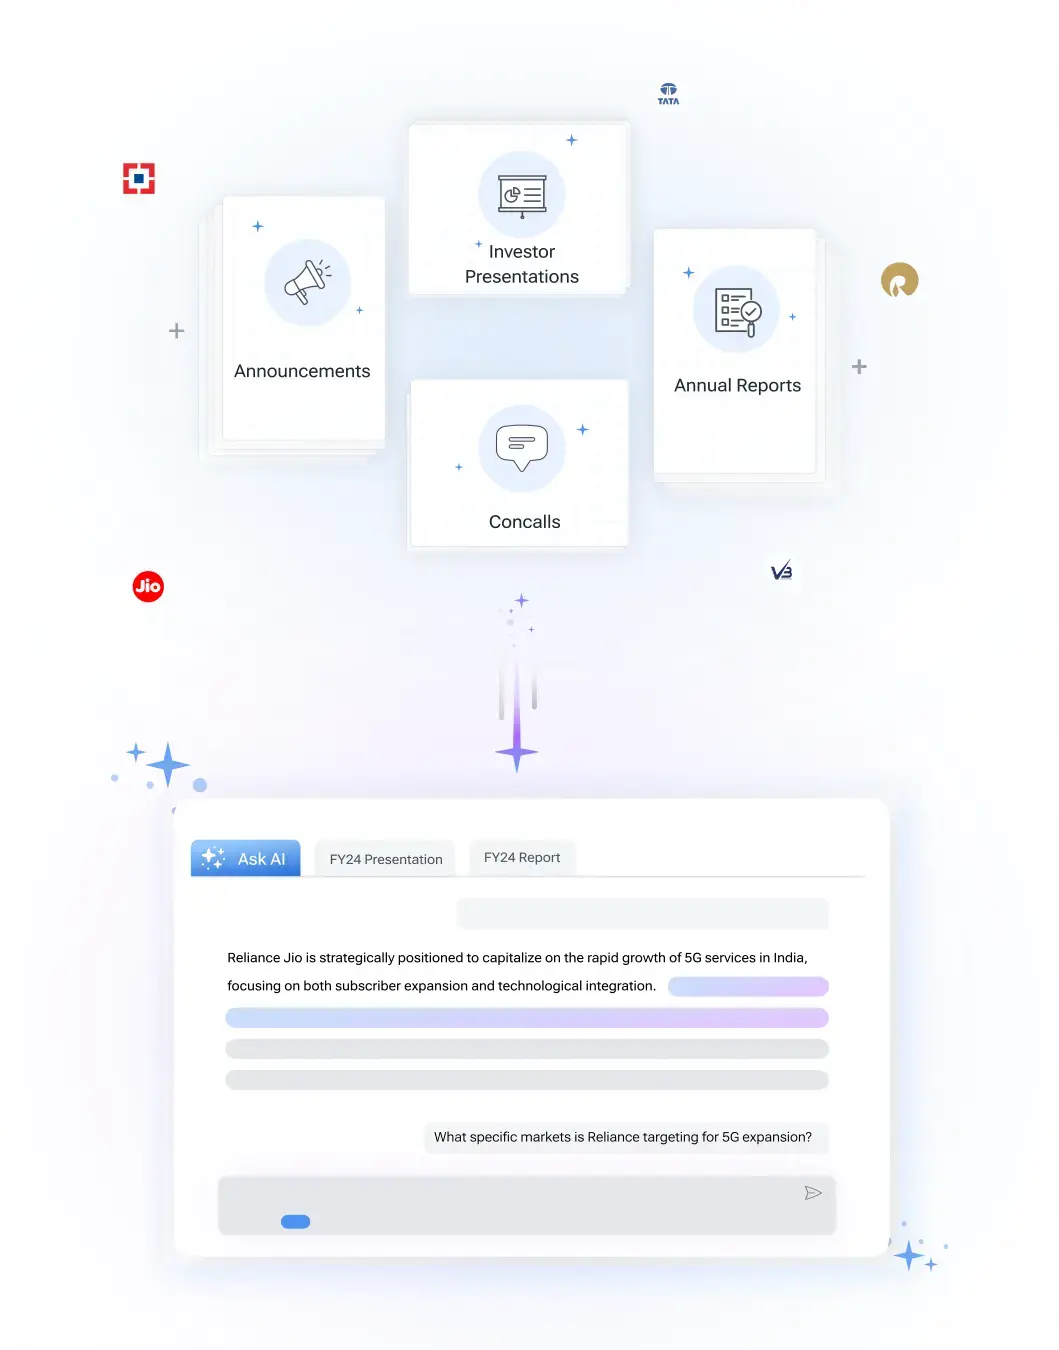
Get instant AI-powered insights about company performance, financials, and strategy. Ask questions about trends, competition, and developments while receiving responses backed by official documents and market data, with clear attribution to source documents.

 Discovery themes featuring this stock
Bearish
2
Neutral
8
Bullish
4
Bearish
8
Neutral
24
Bullish
14
Bearish
6
Neutral
16
Bullish
10


Jindal Supreme (India) Limited manufactures steel pipes, tubes, galvanized products, metal-beam crash barriers, and GI tubular poles from its Hisar, Haryana facility. Its products serve infrastructure, water supply, roads, construction, electrification, industrial, and agricultural applications across more than 20 states through dealers, institutional buyers, EPC companies, contractors, and direct customers.
The company delivered its strongest half-year performance so far in H1 FY27, with revenue rising 23% year on year, EBITDA increasing 64%, and PAT growing 72%. Profitability improved disproportionately because value-added products represented approximately 57% of the mix, while higher utilization improved absorption of fixed manufacturing costs.
Jindal Supreme substantially deleveraged after its IPO, using approximately INR71–72 crore of fresh proceeds to repay borrowings. Debt-to-equity declined to 0.48x from 1.2x in FY26 and 2.1x in FY24, creating financial capacity for brownfield investments and a proposed Raipur greenfield facility.
Growth is being pursued through both product diversification and geographic expansion. Newly introduced or planned products include solar structures and nuts and bolts, while additional galvanizing and crash-barrier capacity is already operating. The proposed Chhattisgarh facility should reduce freight disadvantages and expand access to eastern and central Indian markets.
The key near-term execution opportunity is converting available capacity into higher sales without proportionately increasing fixed costs. Management targets 75%–80% utilization, a 70%–75% value-added mix, lower working-capital days, and stronger H2 performance, although cash flow remains temporarily pressured by inventory and receivables.
Industrial Products
Iron & Steel Products
840 Cr
Low Risk
29.19
30.74
—
4.27
218.25
120.00
Sales CAGR
Profit CAGR
ROE
ROCE



Investor Presentation
Q2 FY27

 Discovery themes featuring this stock
Earnings Call/Transcript
Jindal Supreme (India) Limited filed the transcript of its Q2 and H1 FY27 earnings call held on 17 November 2026.
Earnings Call/Transcript
Jindal Supreme (India) Ltd conducted its earnings conference call on 17 November 2026 and provided the audio recording link.
Regulatory/Compliance Filing
Jindal Supreme (India) Limited filed newspaper advertisements for its unaudited standalone financial results for the quarter and half year ended September 30, 2026.
Investor Presentation
Jindal Supreme (India) Limited submitted an investor presentation highlighting Q2 and H1 FY27 financial performance, including higher revenue, EBITDA and PAT compared with the prior year.
Jindal Supreme (India) Ltd (JSIPL) is currently trading at 165.95 per share. Stock prices fluctuate during market hours on NSE and BSE based on demand, company updates, and overall market conditions. Refer to the live price chart above for the most recent price movement.
Jindal Supreme (India) Limited manufactures steel pipes, tubes, galvanized products, metal-beam crash barriers, and GI tubular poles from its Hisar, Haryana facility. Its products serve infrastructure, water supply, roads, construction, electrification, industrial, and agricultural applications across more than 20 states through dealers, institutional buyers, EPC companies, contractors, and direct customers. The company delivered its strongest half-year performance so far in H1 FY27, with revenue rising 23% year on year, EBITDA increasing 64%, and PAT growing 72%. Profitability improved disproportionately because value-added products represented approximately 57% of the mix, while higher utilization improved absorption of fixed manufacturing costs. Jindal Supreme substantially deleveraged after its IPO, using approximately INR71–72 crore of fresh proceeds to repay borrowings. Debt-to-equity declined to 0.48x from 1.2x in FY26 and 2.1x in FY24, creating financial capacity for brownfield investments and a proposed Raipur greenfield facility. Growth is being pursued through both product diversification and geographic expansion. Newly introduced or planned products include solar structures and nuts and bolts, while additional galvanizing and crash-barrier capacity is already operating. The proposed Chhattisgarh facility should reduce freight disadvantages and expand access to eastern and central Indian markets. The key near-term execution opportunity is converting available capacity into higher sales without proportionately increasing fixed costs. Management targets 75%–80% utilization, a 70%–75% value-added mix, lower working-capital days, and stronger H2 performance, although cash flow remains temporarily pressured by inventory and receivables.
Over the past 52 weeks, Jindal Supreme (India) Ltd has traded between a low of ₹120.00 and a high of ₹218.25. The 52-week high and low indicate the stock’s price range over the last year and help investors understand its volatility and recent trading levels.
Jindal Supreme (India) Ltd has a market capitalization of approximately 839.85. Market capitalization represents the total value of a company’s outstanding shares and helps investors understand its size, stability, and relative risk compared to other listed companies.
Jindal Supreme (India) Ltd’s investment profile depends on its business fundamentals, valuation, and long-term outlook. The stock currently trades at a PE ratio of 29.19 and operates in the its sector sector. Investors typically assess financial performance, growth prospects, and individual risk tolerance before making investment decisions.
Based on its market capitalization of 839.85 Cr, Jindal Supreme (India) Ltd is classified as a Small Cap stock. Large-cap stocks are generally more stable, while mid-cap and small-cap stocks tend to offer higher growth potential along with higher price volatility.
Jindal Supreme (India) Ltd operates in the its sector sector. Sector classification matters because companies in the same sector are often affected by similar economic conditions, regulatory changes, and competitive dynamics, which can influence overall stock performance.
The Price-to-Earnings (PE) ratio of Jindal Supreme (India) Ltd is 29.19. The PE ratio compares a company’s share price to its earnings and is commonly used to assess valuation. Comparing the PE ratio with sector peers and historical levels provides better context.
Jindal Supreme has set March 2028 as its target for production at the Raipur facility. The company said land due diligence was under way and expected the acquisition to close in quarter 4.
Management said Jindal Supreme needs about 80% overall capacity utilisation before a double-digit EBITDA margin can be achieved. It expects to reach that level mostly in Q1 FY28. The stated target is conditional on the planned production ramp.
Jindal Supreme expects ground-mounted solar structures to enter production in Q4 FY27. Management said the related capital expenditure had already been undertaken, but did not disclose the project cost or manufacturing capacity.
Jindal Supreme's calculated borrowings-to-equity ratio was 0.4 at H1FY27. It uses Rs 89.09 crore of current and non-current borrowings and Rs 214.85 crore of total equity, excluding lease liabilities.

| Symbol | Watchlist | Price | Market Cap | P/E | P/B | Div Yield (%) | ROE (%) | ROCE (%) | ROA (%) |
144.30 | 993 Cr | 10.32 | 1.18 | 0.00 | 7.64 | 10.56 | 6.26 | ||
50.10 | 964 Cr | 8.50 | 1.67 | 0.19 | 18.24 | 16.86 | 7.07 | ||
968.35 | 920 Cr | 17.61 | 1.91 | 0.00 | 10.34 | 11.78 | 5.92 | ||
164.60 | 840 Cr | 29.19 | 4.27 | 0.00 | 0.00 | 0.00 | 8.75 | ||
623.80 | 795 Cr | -22.66 | 0.00 | 0.00 | 24.97 | -4.18 | -1.60 | ||
400.80 | 764 Cr | 17.60 | 0.70 | 0.25 | 4.05 | 6.44 | 2.62 | ||
3799.60 | 750 Cr | 2.71 | 1.84 | 2.64 | 10.06 | 12.11 | 58.06 | ||
| Median: 7 Co. | — | 400.80 | 840 Cr | 10.32 | 1.67 | 0.00 | 10.06 | 10.56 | 6.26 |


