Actions
Action Type





IRIS
Multibagg AI is an AI powered stock research and analysis platform. We provide data, information, content, and analytics for publicly traded Indian companies listed on NSE and BSE. AI can make mistakes, check important information.
Prices might be delayed by a few minutes.
Join our Exclusive Community


Join our Exclusive Community
Made with 💙 in India. © Finsky Technologies Pvt Ltd. 2026


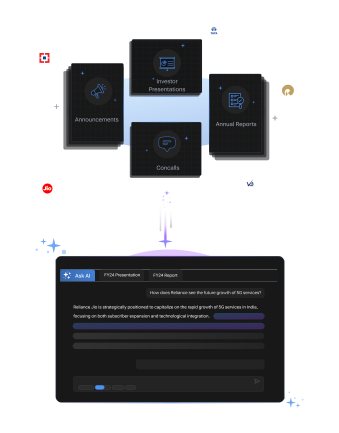
Get instant AI-powered insights about company performance, financials, and strategy. Ask questions about trends, competition, and developments while receiving responses backed by official documents and market data, with clear attribution to source documents.




 Discovery themes featuring this stock
Bearish
8
Neutral
2
Bullish
4
Bearish
16
Neutral
2
Bullish
28
Bearish
8
Neutral
0
Bullish
24
Bearish
8
Neutral
0
Bullish
24
Bearish
8
Neutral
0
Bullish
24
Bearish
8
Neutral
0
Bullish
24
View Standalone
View Standalone
View Standalone
View Standalone
View Standalone
View Standalone
View Standalone
View Standalone

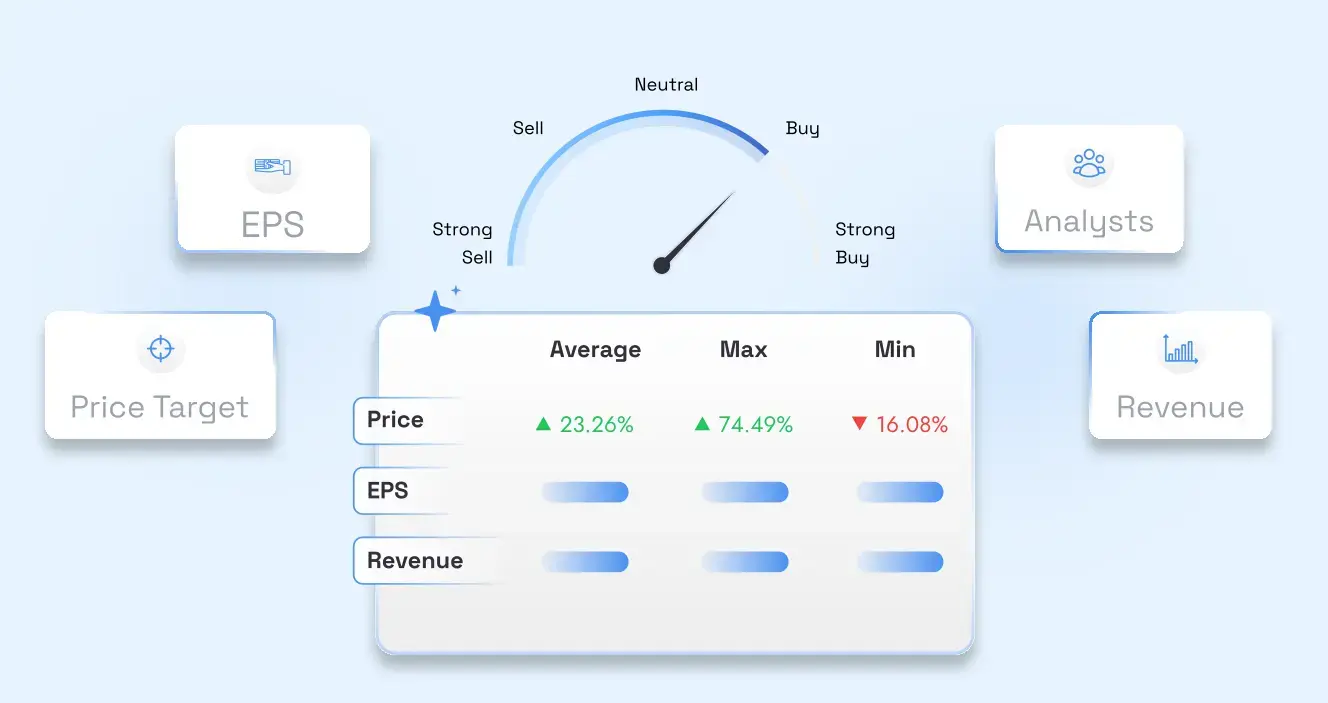
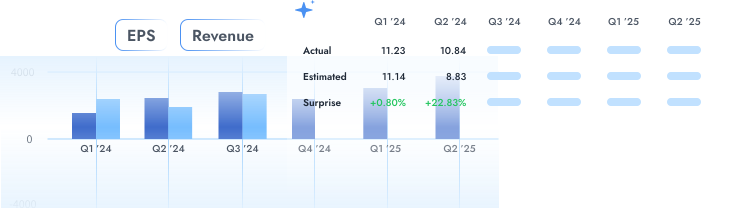




V-Guard Industries is an Indian mass-market manufacturer, marketer and seller of electronics, electrical products and consumer durables, including stabilizers, inverters, batteries, wires, pumps, switches, fans, water heaters and kitchen appliances. It operates manufacturing facilities across southern, northern and northeastern India and sells largely through general trade.
The company delivered exceptionally strong Q2 FY27 growth, with consolidated revenue increasing 38.2% year-on-year to INR 1,853 crore. Electronics grew 60%, Electricals 41.2% and Consumer Durables 20%, demonstrating broad-based momentum, although wire growth was predominantly price-led rather than volume-led.
V-Guard's emerging solar power systems business is still small and largely outsourced, but management sees a strategic right to win through its established inverter, battery, electronics and distribution capabilities. The company currently targets residential rooftop systems through system integrators, with expansion beyond southern markets planned.
Profitability improved despite gross-margin pressure: Q2 EBITDA rose 53.7% to INR 168 crore, with margin expanding to 9.1%, while PAT increased 71% to INR 112 crore. However, management acknowledged a remaining 3% to 4% pricing gap against input-cost inflation, making further price increases important for margin protection.
Sunflame's integration is beginning to show results, with revenue growing 20.5% year-on-year, while product refreshes are being rolled out across its dated portfolio. At the same time, lighting remains in a controlled test-market phase, and management expects a more meaningful contribution only after wider SKU availability and distribution expansion.
Consumer Durables
Household Appliances
13,329 Cr
Low Risk
32.4
43.5
2.6
5.2
356.85
252.55
Sales CAGR
Profit CAGR
ROE
ROCE
Discovery themes featuring this stockV-Guard Industries Ltd (VGUARD) is currently trading at 307.30 per share. Stock prices fluctuate during market hours on NSE and BSE based on demand, company updates, and overall market conditions. Refer to the live price chart above for the most recent price movement.
V-Guard Industries is an Indian mass-market manufacturer, marketer and seller of electronics, electrical products and consumer durables, including stabilizers, inverters, batteries, wires, pumps, switches, fans, water heaters and kitchen appliances. It operates manufacturing facilities across southern, northern and northeastern India and sells largely through general trade. The company delivered exceptionally strong Q2 FY27 growth, with consolidated revenue increasing 38.2% year-on-year to INR 1,853 crore. Electronics grew 60%, Electricals 41.2% and Consumer Durables 20%, demonstrating broad-based momentum, although wire growth was predominantly price-led rather than volume-led. V-Guard's emerging solar power systems business is still small and largely outsourced, but management sees a strategic right to win through its established inverter, battery, electronics and distribution capabilities. The company currently targets residential rooftop systems through system integrators, with expansion beyond southern markets planned. Profitability improved despite gross-margin pressure: Q2 EBITDA rose 53.7% to INR 168 crore, with margin expanding to 9.1%, while PAT increased 71% to INR 112 crore. However, management acknowledged a remaining 3% to 4% pricing gap against input-cost inflation, making further price increases important for margin protection. Sunflame's integration is beginning to show results, with revenue growing 20.5% year-on-year, while product refreshes are being rolled out across its dated portfolio. At the same time, lighting remains in a controlled test-market phase, and management expects a more meaningful contribution only after wider SKU availability and distribution expansion.
Over the past 52 weeks, V-Guard Industries Ltd has traded between a low of ₹252.55 and a high of ₹356.85. The 52-week high and low indicate the stock’s price range over the last year and help investors understand its volatility and recent trading levels.
V-Guard Industries Ltd has a market capitalization of approximately 13,328.70. Market capitalization represents the total value of a company’s outstanding shares and helps investors understand its size, stability, and relative risk compared to other listed companies.
V-Guard Industries Ltd’s investment profile depends on its business fundamentals, valuation, and long-term outlook. The stock currently trades at a PE ratio of 32.42 and operates in the its sector sector. Investors typically assess financial performance, growth prospects, and individual risk tolerance before making investment decisions.
Based on its market capitalization of 13,328.70 Cr, V-Guard Industries Ltd is classified as a Small Cap stock. Large-cap stocks are generally more stable, while mid-cap and small-cap stocks tend to offer higher growth potential along with higher price volatility.
V-Guard Industries Ltd operates in the its sector sector. Sector classification matters because companies in the same sector are often affected by similar economic conditions, regulatory changes, and competitive dynamics, which can influence overall stock performance.
The Price-to-Earnings (PE) ratio of V-Guard Industries Ltd is 32.42. The PE ratio compares a company’s share price to its earnings and is commonly used to assess valuation. Comparing the PE ratio with sector peers and historical levels provides better context.
No. V-Guard said it is not manufacturing for the rooftop-solar business yet. Management said the business is still nascent and that it is working through different aspects of the opportunity.
V-Guard said second-half volume growth may be in the mid-teens. Management also said H2 growth should be lower than H1 because the prior-year second half had a better growth base.
V-Guard said Sunflame missed a product-refresh cycle, leaving practically its entire portfolio dated. Management linked the gap to an approximately four-year period spanning COVID-related disruption and transaction-related work. It did not present weak demand as the sole cause of Sunflame’s performance.
V-Guard said it needed a minimum 3%-4% additional price increase based on its latest input-cost position. Management said material prices were still moving, so the required amount could evolve with commodity markets.


| Symbol | Watchlist | Price | Market Cap | P/E | P/B | Div Yield (%) | ROE (%) | ROCE (%) | ROA (%) |
211.10 | 13,593 Cr | -83.40 | 4.48 | 1.42 | 16.08 | 24.08 | -2.71 | ||
304.95 | 13,329 Cr | 32.42 | 5.20 | 0.49 | 16.04 | 20.50 | 9.61 | ||
829.10 | 10,519 Cr | 44.69 | 2.49 | 0.60 | 6.22 | 8.73 | 3.18 | ||
562.05 | 7,698 Cr | 33.29 | 3.75 | 1.33 | 11.70 | 15.35 | 7.86 | ||
371.30 | 7,195 Cr | 37.45 | 1.52 | 0.00 | 4.05 | 5.38 | 2.69 | ||
1769.80 | 4,812 Cr | 1620.23 | 9.98 | 2.03 | 1.79 | 3.22 | 0.19 | ||
1125.55 | 4,561 Cr | 30.82 | 4.24 | 0.00 | 13.76 | 16.89 | 5.41 | ||
| Median: 7 Co. | — | 562.05 | 7,698 Cr | 33.29 | 4.24 | 0.60 | 11.70 | 15.35 | 3.18 |