










Adani Power Ltd. H1 FY27 margin reached 44% as PLF hit 74%
Key highlights
- Adani Power reported H1 FY27 revenue from operations of Rs 38,341 crore and EBITDA of Rs 17,112 crore.
- Adani Power’s H1 FY27 EBITDA margin was 44%, compared with 40% in FY26.
- Adani Power reported H1 FY27 PLF of 74% and plant availability of 93%.
- Adani Power had Rs 45,539 crore of CWIP at 30 September 2026.
powered by IRIS
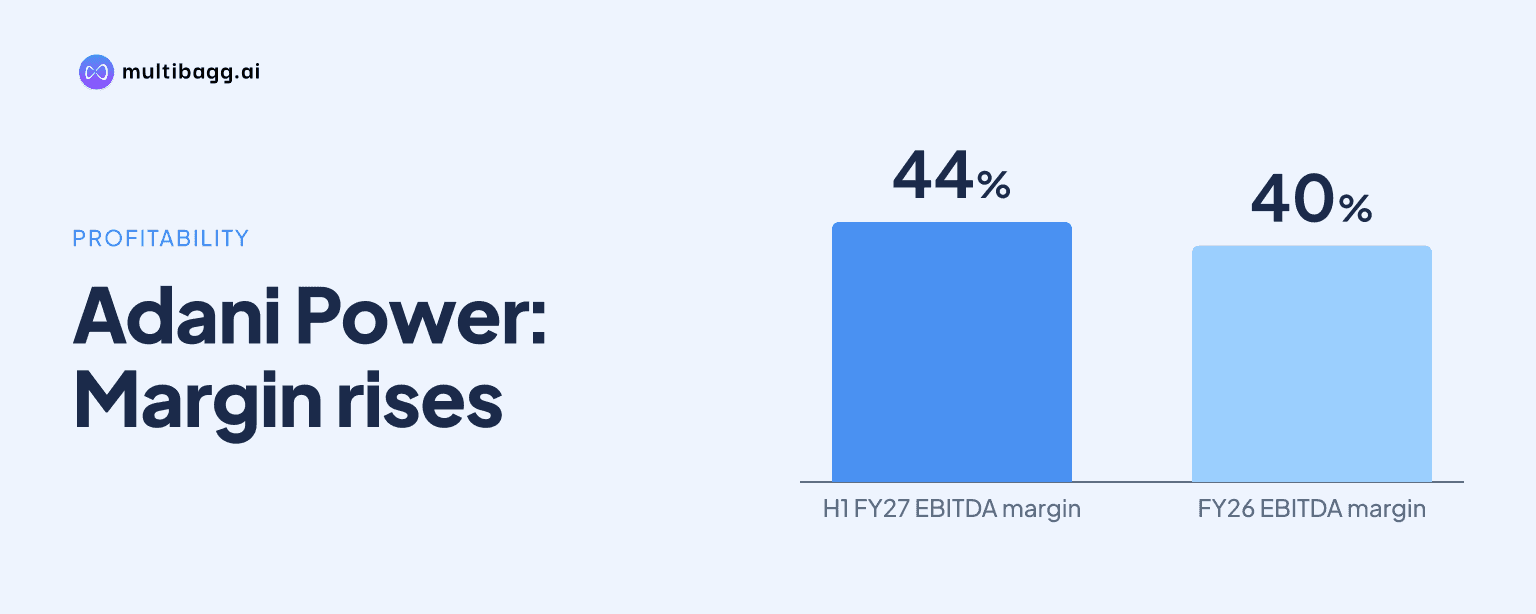
Adani Power Ltd. reported a 44% EBITDA margin in H1 FY27 as plant load factor reached 74%, compared with 40% and 67%, respectively, in FY26; revenue from operations was Rs 38,341 crore, EBITDA was Rs 17,112 crore and profit after tax was Rs 11,886 crore.
Know Adani Power inside out
Results, valuation, peers and who's buying, in one view.
Can Adani Power’s 91% H1 FY27 profit-growth claim be verified?
No, Adani Power’s supplied presentation does not disclose H1 FY26 profit after tax, the comparable figure required to verify a 91% year-on-year increase. The historical table gives H1 FY27 PAT of Rs 11,886 crore, but provides only full-year figures for FY22 through FY26.
Adani Power reported full-year PAT of Rs 12,971 crore in FY26, compared with Rs 12,750 crore in FY25 and Rs 20,829 crore in FY24. Those annual totals cannot be used as the denominator for a first-half year-on-year calculation, because H1 FY27 is a partial-year period. The presentation also lists Q2 FY27 PAT of Rs 7,019 crore, but no Q2 FY26 comparison.
What did Adani Power report for H1 FY27 earnings?
Adani Power reported H1 FY27 revenue from operations of Rs 38,341 crore, total income of Rs 39,273 crore, EBITDA of Rs 17,112 crore and PAT of Rs 11,886 crore. Other income was Rs 932 crore, while total operating expenses were Rs 22,161 crore during the period.
Adani Power’s EBITDA margin was 44% in H1 FY27, versus 40% in FY26 and 41% in FY25. Margin percentages permit a comparison between the first-half and full-year periods that absolute rupee totals do not. H1 FY27 earnings per share were Rs 6.08, compared with Rs 6.62 for full-year FY26.
Fuel cost was Adani Power’s largest operating-cost line at Rs 19,734 crore in H1 FY27, followed by other expenses of Rs 1,699 crore and employee benefit expenses of Rs 433 crore. Depreciation and amortisation were Rs 2,358 crore, finance costs were Rs 1,662 crore, and the share of profit from associate or joint venture was Rs 115 crore.
Which operating metrics changed in H1 FY27?
Adani Power’s plant availability rose to 93% in H1 FY27 from 89% in FY26, while plant load factor, or PLF, increased to 74% from 67%. Effective capacity was 18,150 megawatts (MW), compared with 18,000 MW in FY26 and 16,545 MW in FY25.
Adani Power’s power purchase agreement, or PPA, realisation was Rs 6.06 per kilowatt-hour in H1 FY27, up from Rs 5.53 per kilowatt-hour in FY26. Merchant realisation increased to Rs 7.12 per kilowatt-hour from Rs 5.30 per kilowatt-hour. The presentation reports these higher realisations alongside the 44% EBITDA margin, but does not provide a profit bridge attributing changes in PAT to particular operating measures.
The H1 FY27 figures reversed parts of the FY26 movement from FY25. PLF had fallen to 67% in FY26 from 71% in FY25, PPA realisation had declined from Rs 5.60 per kilowatt-hour, and merchant realisation had decreased from Rs 5.93 per kilowatt-hour. H1 FY27 exceeded FY26 on availability, PLF and both disclosed realisation measures.
Got a follow-up? Ask IRIS
How does H1 FY27 compare with Adani Power’s recent history?
Adani Power’s revenue from operations increased from Rs 27,711 crore in FY22 to Rs 54,241 crore in FY26, representing the presentation’s stated 18% compound annual growth rate, or CAGR. EBITDA rose from Rs 13,789 crore to Rs 23,431 crore over the same FY22-to-FY26 period, for a stated 14% CAGR.
The annual trend was uneven. Revenue reached Rs 56,203 crore in FY25 before declining to Rs 54,241 crore in FY26, while EBITDA declined from Rs 24,008 crore to Rs 23,431 crore. PAT fell from Rs 20,829 crore in FY24 to Rs 12,750 crore in FY25, then rose to Rs 12,971 crore in FY26.
Adani Power’s reported PAT CAGR was 27% between FY22 and FY26, exceeding its stated 18% revenue CAGR for that period. Earnings per share increased from Rs 1.93 in FY22 to Rs 6.62 in FY26, while the FY27 first-half figure was Rs 6.08. These are reported historical trends rather than a like-for-like comparison of H1 FY27 with the prior first half.
What balance-sheet and capacity figures accompany the results?
Adani Power reported total assets of Rs 1,65,640 crore at 30 September 2026, up from Rs 1,42,280 crore at 31 March 2026. Net fixed assets including capital work in progress, or CWIP, rose to Rs 1,14,070 crore from Rs 1,04,455 crore, and CWIP increased to Rs 45,539 crore from Rs 35,053 crore.
Cash and cash equivalents were Rs 16,014 crore at 30 September 2026, compared with Rs 8,418 crore at 31 March 2026. Total equity increased to Rs 78,377 crore from Rs 66,402 crore, while long-term borrowings rose to Rs 49,158 crore from Rs 44,493 crore and short-term borrowings increased to Rs 12,703 crore from Rs 9,063 crore.
Adani Power’s Q2 FY27 update lists operating capacity of 18,330 MW, whereas the H1 historical table shows 18,150 MW of effective capacity. The portfolio presentation identifies 23,720 MW of locked-in capacity and a target capacity of 42,050 MW. It also reports trailing-12-month return on assets of 18.7%, return on capital employed of 22.1%, and return on equity of 27% at September 2026.
Conclusion
Adani Power’s H1 FY27 performance combined a 74% PLF, 93% plant availability, Rs 6.06 per kilowatt-hour PPA realisation and Rs 7.12 per kilowatt-hour merchant realisation with a 44% EBITDA margin. The period delivered Rs 17,112 crore of EBITDA and Rs 11,886 crore of PAT, but the presentation does not disclose H1 FY26 profit and therefore cannot substantiate a 91% first-half PAT growth rate.
The next items to watch are progress on the stated 42,050 MW target capacity, conversion of the disclosed 23,720 MW locked-in capacity, and movement in the Rs 45,539 crore CWIP balance reported at 30 September 2026. Future disclosures on PLF, PPA realisation, merchant realisation and borrowings will show how those expansion figures align with operating performance.