










Adani Power H1 FY27 PAT was Rs 11,891 crore, margin 44%
Key highlights
- Adani Power reported H1 FY27 PAT of Rs 11,891.25 crore and EBITDA of Rs 17,113.89 crore.
- H1 FY27 EBITDA margin was 44%, compared with 40% in FY26.
- Plant load factor increased to 74% in H1 FY27 from 67% in FY26.
- Cash and cash equivalents were Rs 16,019.21 crore at 30 September 2026.
powered by IRIS
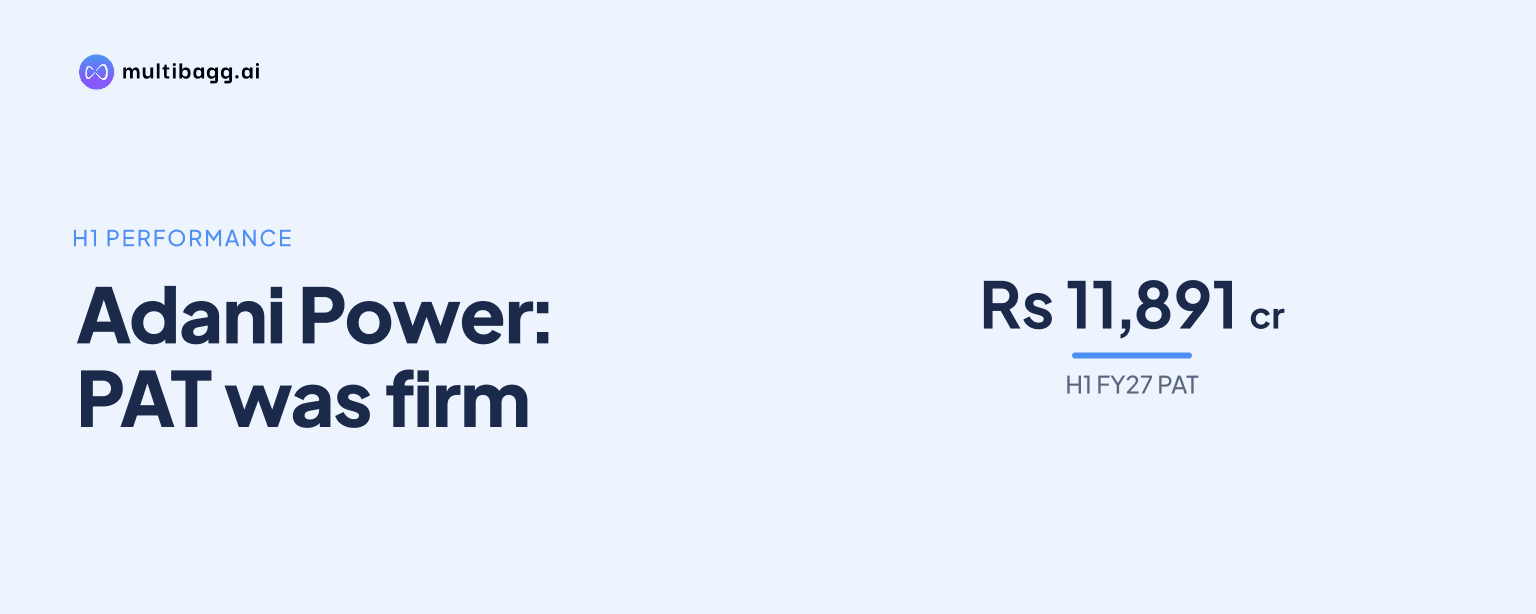
Adani Power Ltd. reported profit after tax of Rs 11,891.25 crore in H1 FY27, while EBITDA margin reached 44% and plant load factor rose to 74%. The half-year result included Rs 38,341.90 crore of revenue from operations, compared with a 40% EBITDA margin and 67% plant load factor in FY26.
Know Adani Power inside out
Results, valuation, peers and who's buying, in one view.
What did Adani Power report in H1 FY27?
Adani Power reported H1 FY27 revenue from operations of Rs 38,341.90 crore, EBITDA of Rs 17,113.89 crore and profit after tax, or PAT, of Rs 11,891.25 crore. Total income was Rs 39,273.63 crore, comprising operating revenue and Rs 932.27 crore of other income, while the company reported a 44% EBITDA margin.
The presentation’s historical table compares H1 FY27 with full-year FY22 through FY26 figures rather than with H1 FY26. It therefore establishes the reported H1 FY27 PAT level but does not provide a like-for-like first-half figure from the prior year to support a year-on-year PAT growth calculation. The presentation cites a 3% three-year compound annual growth rate, or CAGR, for PAT, while the table shows FY22 PAT of Rs 4,828.46 crore and FY26 PAT of Rs 12,971.27 crore.
H1 FY27 PAT was equivalent to about 92% of FY26 PAT, but the comparison is between a six-month and a 12-month period. Finance costs were Rs 1,664.78 crore in H1 FY27 versus Rs 3,363.23 crore in FY26, while current tax was Rs 2,920.49 crore in the half year compared with Rs 1,562.09 crore for FY26. H1 FY27 also included Rs 114.16 crore of profit from an associate or joint venture.
How did Adani Power’s operating performance change?
Adani Power’s plant load factor, or PLF, increased to 74% in H1 FY27 from 67% in FY26, and plant availability increased to 93% from 89%. Effective capacity in the historical operating table increased by 150 megawatts, or MW, to 18,150 MW from 18,000 MW in FY26. A separate Q2 FY27 insight reports operating capacity of 18,330 MW.
The 74% H1 FY27 PLF was the highest level shown in the FY22-to-H1 FY27 series. It was above 71% in FY25, 65% in FY24, 48% in FY23 and 52% in FY22. Plant availability recovered four percentage points from FY26, although the 93% reading remained below 95% in FY22 and 94% in FY23.
Power purchase agreement, or PPA, realisation was Rs 6.06 per kilowatt-hour, or kWh, in H1 FY27, up from Rs 5.53 per kWh in FY26. Merchant realisation increased to Rs 7.12 per kWh from Rs 5.30 per kWh. The H1 FY27 merchant figure also exceeded Rs 5.93 per kWh in FY25 and Rs 6.92 per kWh in FY24.
What changed in Adani Power’s EBITDA margin?
Adani Power’s EBITDA margin rose to 44% in H1 FY27 from 40% in FY26, a four-percentage-point increase. The H1 FY27 margin matched FY22’s 44% but was below FY24’s 47%; it was above the 41% reported in FY25 and the 33% reported in FY23.
Total operating expenses were Rs 22,165.79 crore in H1 FY27 against revenue from operations of Rs 38,341.90 crore. Fuel cost was Rs 19,743.46 crore, other expenses were Rs 1,702.83 crore, employee benefit expenses were Rs 437.67 crore and transmission charges were Rs 256.85 crore. Purchase of stock-in-trade and power was Rs 38.05 crore, compared with Rs 211.92 crore in FY26.
The source does not separately quantify how each operational metric affected the 44% margin. However, H1 FY27 combined a 74% PLF, Rs 6.06 per kWh PPA realisation and Rs 7.12 per kWh merchant realisation, whereas FY26 recorded a 67% PLF, Rs 5.53 per kWh PPA realisation and Rs 5.30 per kWh merchant realisation alongside a 40% margin.
Got a follow-up? Ask IRIS
How had Adani Power’s balance sheet changed by September 2026?
Adani Power reported total assets of Rs 165,535.04 crore at 30 September 2026, up from Rs 142,280.96 crore at 31 March 2026. Total equity rose to Rs 78,375.60 crore from Rs 66,382.77 crore, while total liabilities increased to Rs 87,257.04 crore from Rs 75,898.19 crore over the same period.
Gross fixed assets including capital work in progress, or CWIP, reached Rs 152,708.17 crore at 30 September 2026, compared with Rs 140,494.13 crore at 31 March 2026. CWIP increased to Rs 45,541.37 crore from Rs 35,045.27 crore, and net fixed assets including CWIP rose to Rs 114,063.72 crore from Rs 104,433.07 crore.
Cash and cash equivalents increased to Rs 16,019.21 crore at September 2026 from Rs 8,414.99 crore at March 2026. Long-term borrowings increased to Rs 49,170.72 crore from Rs 44,479.85 crore, while short-term borrowings rose to Rs 12,701.68 crore from Rs 9,059.58 crore. The presentation reports trailing-12-month return on assets of 19.1%, return on capital employed of 21.7% and return on equity of 26.5% at September 2026.
What capacity expansion does Adani Power disclose?
Adani Power discloses 18,330 MW of operating capacity across 14 assets, 23,720 MW of locked-in capacity across 13 projects and target capacity of 42,050 MW across 18 assets. The target capacity excludes 3 gigawatts, or GW, of projects at proposal stage, according to the presentation’s note.
The operating portfolio is 59% organic and 41% inorganic by asset type, with 95% of capacity tied up under PPAs and 5% open. Its technology mix is 51% supercritical, 9% ultra-supercritical and 41% other technologies. In the locked-in portfolio, 94% is ultra-supercritical, 62% has PPA tie-ups to date and 38% is shown as open.
Adani Power also identifies more than 16 GW of ongoing thermal PPA bids. The source links the capacity build-out context with CWIP of Rs 45,541.37 crore at 30 September 2026, but does not disclose commissioning dates, project-level capital expenditure, funding plans or expected earnings contribution for the 42,050 MW target.
Conclusion
Adani Power’s H1 FY27 figures show Rs 11,891.25 crore of PAT, Rs 17,113.89 crore of EBITDA and a 44% EBITDA margin. Higher PLF, availability and reported PPA and merchant realisations coincided with the margin increase from FY26, while assets, CWIP, cash and borrowings all increased by September 2026.
The next disclosed developments to watch are progress toward 42,050 MW of target capacity, outcomes from more than 16 GW of thermal PPA bids and conversion of 23,720 MW of locked-in projects into operating capacity. The presentation leaves the timing, capital cost and funding requirements of that expansion unresolved.