










Ashutosh Fibre H1 FY27 revenue gains 7.3%, Q2 EBITDA margin 23.69%
Key highlights
- Ashutosh Fibre reported H1 FY27 revenue from operations of Rs 65.28 crore, up 7.3% from Rs 60.83 crore.
- H1 FY27 EBITDA was Rs 15.46 crore, up 3.6%, while PAT reached Rs 8.02 crore, up 6.8%.
- Ashutosh Fibre listed Q2FY27 EBITDA margin at 23.69% and PAT margin at 12.29%.
- Indutech generated Rs 31.07 crore, or 47.60%, of Ashutosh Fibre’s H1 FY27 revenue.
powered by IRIS
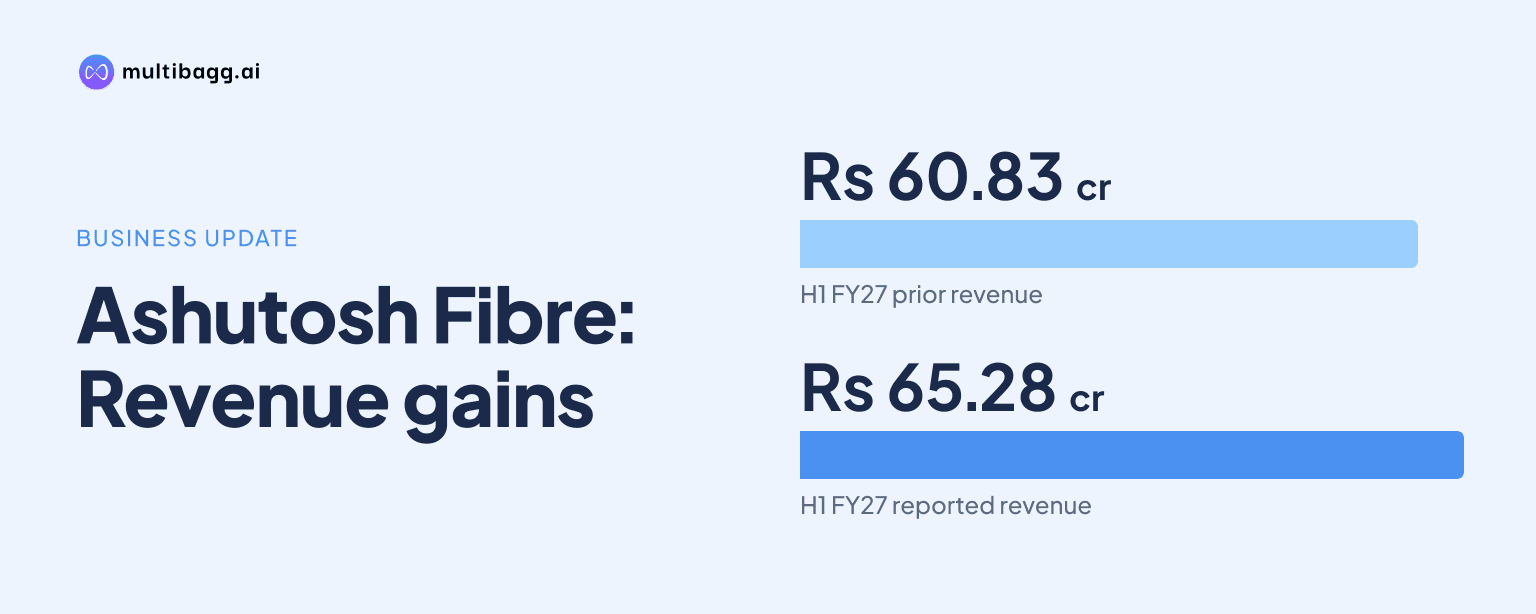
Ashutosh Fibre Ltd reported H1 FY27 revenue from operations of Rs 65.28 crore, up 7.3% from Rs 60.83 crore in H1 FY26, while its presentation listed Q2FY27 earnings before interest, tax, depreciation and amortisation (EBITDA) margin at 23.69%. H1 FY27 profit after tax rose 6.8% to Rs 8.02 crore.
Know Ashutosh Fibre inside out
Results, valuation, peers and who's buying, in one view.
How did Ashutosh Fibre perform in H1 FY27?
Ashutosh Fibre recorded revenue from operations of Rs 65.28 crore in H1 FY27, compared with Rs 60.83 crore in H1 FY26. The Rs 4.45 crore increase equated to the company’s stated year-on-year growth of 7.3%, and management described the period as showing continued business momentum.
EBITDA increased 3.6% to Rs 15.46 crore in H1 FY27 from Rs 14.93 crore in H1 FY26. Profit after tax, or PAT, rose 6.8% to Rs 8.02 crore from Rs 7.51 crore, meaning PAT grew faster than EBITDA but slightly slower than revenue during the first-half comparison.
The disclosed H1 FY27 figures show a difference between the 7.3% revenue increase and the 3.6% EBITDA increase. Ashutosh Fibre did not provide a line-by-line income statement or identify cost, finance-cost or tax items that explain the different growth rates between H1 FY26 and H1 FY27.
What happened to Ashutosh Fibre’s margins?
Ashutosh Fibre listed EBITDA margin of 23.69% for Q2FY27, compared with 24.54% for Q2FY26. The 0.85-percentage-point change came alongside the company’s H1 FY27 revenue of Rs 65.28 crore, and the presentation described the Q2FY27 EBITDA margin as remaining stable despite business expansion.
PAT margin was 12.29% in Q2FY27, versus 12.35% in Q2FY26, a movement of 0.06 percentage points. The presentation said the PAT margin was sustained at 12.29%, while reporting H1 FY27 PAT of Rs 8.02 crore and H1 FY26 PAT of Rs 7.51 crore.
The margin slide uses Q2FY26 and Q2FY27 labels, whereas the revenue, EBITDA and PAT amounts are labelled H1 FY26 and H1 FY27. The supplied presentation does not provide separate quarterly revenue, EBITDA or PAT amounts, so the quarterly margin comparison should be read using the periods shown by Ashutosh Fibre.
Which verticals made up Ashutosh Fibre’s H1 FY27 revenue?
Ashutosh Fibre’s largest disclosed H1 FY27 vertical was Indutech, which generated Rs 31.07 crore, or 47.60% of total revenue. Mobiltech contributed Rs 20.24 crore, or 31.00%, while Protech generated Rs 13.14 crore, equal to 20.13% of the Rs 65.28 crore total.
The three principal verticals, Indutech, Mobiltech and Protech, together accounted for 98.73% of H1 FY27 revenue. Waste and scrap or unclassified revenue was Rs 13.86 lakh, representing 0.21%, and other income from operations was Rs 68.17 lakh, or 1.04%.
Indutech exceeded Mobiltech revenue by Rs 10.83 crore and Protech revenue by Rs 17.93 crore in H1 FY27. Ashutosh Fibre did not disclose H1 FY26 revenue by vertical, so the presentation does not show which segment contributed most to the Rs 4.45 crore overall revenue increase.
Got a follow-up? Ask IRIS
How were Ashutosh Fibre’s domestic and export revenues split?
Ashutosh Fibre reported domestic sales of Rs 32.80 crore in H1 FY27, representing 50.25% of revenue, while export sales were Rs 25.36 crore, or 38.85%. Domestic sales therefore exceeded exports by Rs 7.44 crore, though exports remained close to two-fifths of the Rs 65.28 crore total.
Job-work income contributed Rs 6.43 crore, or 9.86%, and other income from operations added Rs 68.17 lakh, or 1.04%. Domestic and export sales together represented 89.10% of H1 FY27 revenue, while job work and other operating income made up the remaining 10.90%.
The presentation characterises exports, at 38.85% of revenue, as a key contributor to growth and describes the revenue mix as balanced. It does not provide domestic sales, export sales or job-work income for H1 FY26, so it does not establish whether the reported 7.3% revenue growth was led by domestic demand, international sales or job work.
What is Ashutosh Fibre planning after H1 FY27?
Ashutosh Fibre is undertaking a 1,250 metric-tonnes-per-annum capacity expansion at its Petlad facility, with commercialisation expected by June 2027, according to Managing Director and Chairman Siddharth Prakash Patel. Management said advanced spinning machinery and related equipment will support the project and strengthen manufacturing capability for growing demand.
Management also said it is developing modacrylic-based technical fabrics, expanding its domestic and international presence, and investing in rooftop and captive solar power. The presentation gives no project cost, funding detail, projected revenue or margin target for the 1,250-metric-tonnes-per-annum Petlad expansion.
Ashutosh Fibre reported existing installed capacity of 4,775 metric tonnes across synthetic yarn and polypropylene yarn, with combined capacity utilisation of 89.52% in FY26. The planned Petlad addition is about 26% of that existing installed capacity, but the presentation does not state the expected utilisation level after commercialisation in June 2027.
Conclusion
Ashutosh Fibre increased H1 FY27 revenue by 7.3% to Rs 65.28 crore, while EBITDA rose 3.6% to Rs 15.46 crore and PAT increased 6.8% to Rs 8.02 crore. Indutech supplied 47.60% of revenue, and the disclosed Q2FY27 EBITDA and PAT margins were 23.69% and 12.29%, respectively.
The next disclosed operating milestone is commercialisation of the 1,250-metric-tonnes-per-annum Petlad capacity expansion by June 2027. Future disclosures will need to clarify its cost and funding, the effect on capacity utilisation from the FY26 level of 89.52%, and whether modacrylic-based fabrics and solar investments produce measurable financial outcomes.