










Augmont Enterprises Limited equity reaches Rs 1,728 crore
Key highlights
- Augmont’s total equity increased to Rs 1,728 crore at September 2026 from Rs 933 crore at March 2026.
- Trade receivables rose to Rs 749 crore at September 2026 from Rs 182 crore at March 2026.
- Total borrowings declined to Rs 3 crore at September 2026 from Rs 13 crore at March 2026.
- The Rs 620 crore fresh IPO issue expanded Augmont’s equity base ahead of capital deployment.
powered by IRIS
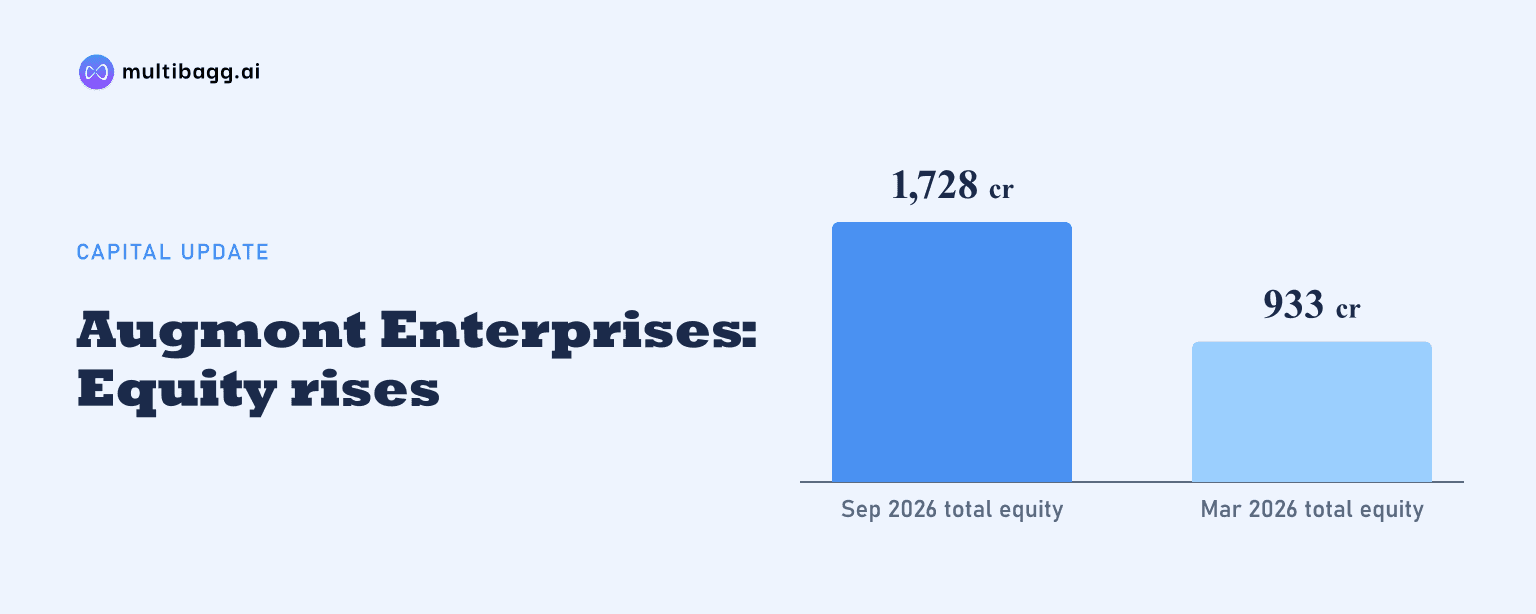
Augmont Enterprises Limited reported total equity of Rs 1,728 crore at September 2026, up from Rs 933 crore in March 2026, following a Rs 620 crore fresh initial public offering (IPO) issue; trade receivables rose to Rs 749 crore from Rs 182 crore. Total borrowings declined to Rs 3 crore from Rs 13 crore over the same six-month period.
Know Augmont Enterprises inside out
Results, valuation, peers and who's buying, in one view.
What changed in Augmont’s balance sheet after the IPO?
Augmont’s consolidated total assets rose to Rs 2,038 crore in September 2026 from Rs 1,257 crore in March 2026, alongside the increase in total equity to Rs 1,728 crore from Rs 933 crore. Equity share capital increased to Rs 46 crore from Rs 42 crore, while other equity increased to Rs 1,651 crore from Rs 865 crore. Non-controlling interest was Rs 31 crore at September, compared with Rs 26 crore in March.
Current assets accounted for most of the asset increase, rising to Rs 1,923 crore from Rs 1,200 crore, while non-current assets increased to Rs 115 crore from Rs 57 crore. The presentation states that the Rs 620 crore IPO fresh issue expanded the equity base ahead of capital deployment. Management says return ratios will reflect the pace at which those proceeds are deployed into growth.
How much debt did Augmont have at September 2026?
Augmont reported total borrowings of Rs 3 crore at September 2026, comprising Rs 1 crore of non-current borrowings and Rs 2 crore of current borrowings. This was lower than total borrowings of Rs 13 crore at March 2026, comprising Rs 1 crore of non-current borrowings and Rs 12 crore of current borrowings. Lease liabilities were separately reported at Rs 7 crore in September, against Rs 5 crore in March.
The debt-to-equity ratio was 0.002 times in H1 FY27, compared with 0.01 times in FY26, 0.05 times in FY25 and 0.29 times in FY24. H1 FY27 means the first half of financial year 2027. The ratio change coincided with total equity increasing to Rs 1,728 crore in H1 FY27 from Rs 933 crore in FY26, while balance-sheet borrowings at September were Rs 3 crore.
Why did Augmont’s trade receivables rise to Rs 749 crore?
Augmont’s trade receivables were Rs 749 crore at September 2026, compared with Rs 182 crore at March 2026. The presentation provides the reported receivables figures but does not explain the counterparties, ageing or collection timing behind the increase. Other current assets also rose, reaching Rs 443 crore from Rs 280 crore over the same period.
The receivables movement came while inventories were broadly unchanged at Rs 341 crore in September 2026 and Rs 342 crore in March 2026. Cash and cash equivalents increased to Rs 171 crore from Rs 87 crore, while loans and advances declined to Rs 1 crore from Rs 119 crore. Other financial assets, including current and non-current balances, totalled Rs 217 crore in September, compared with Rs 101 crore in March.
Got a follow-up? Ask IRIS
What do the capital-efficiency ratios show after the equity increase?
Augmont reported annualised return on equity of 27.1% for H1 FY27, compared with 51.0% for FY26. Return on capital employed was annualised at 24.6% for H1 FY27, compared with 40.3% in FY26. The presentation identifies both H1 FY27 measures as annualised, so they are presented on a different period basis from the full-year FY26 ratios.
Revenue from operations was Rs 34,781 crore in H1 FY27, while profit after tax was Rs 181 crore and earnings before interest, tax, depreciation and amortisation, or EBITDA, were Rs 265 crore. In FY26, revenue from operations was Rs 94,186 crore, profit after tax was Rs 348 crore and EBITDA was Rs 482 crore. The presentation says FY26 revenue was about 140 times average shareholders’ equity, reflecting the business’s high-throughput model.
How does Augmont’s enterprise business affect capital deployment?
Augmont states that its SPOT platform accounts for the majority of the enterprise business and is working-capital-intensive, meaning revenue is capped by capital available for deployment. In the second quarter (Q2) of FY27, enterprise revenue was Rs 13,852 crore, down 32% year on year, while consumer revenue was Rs 1,984 crore, up 47% year on year. Total Q2 FY27 revenue was Rs 15,836 crore, down 27% year on year.
The presentation attributes lower enterprise volumes to higher gold and silver prices, which meant the same capital bought fewer tonnes. Gold enterprise volume was 7.6 metric tonnes in Q2 FY27, down from 15.9 metric tonnes in Q2 FY26, while gold realisation increased to Rs 14,839 per gram from Rs 10,351 per gram. Silver enterprise volume declined to 113.0 metric tonnes from 315.4 metric tonnes, as silver realisation rose to Rs 228 per gram from Rs 122 per gram.
Conclusion
Augmont’s September 2026 balance sheet shows a substantially larger equity base, with total equity reaching Rs 1,728 crore and assets reaching Rs 2,038 crore. Borrowings declined to Rs 3 crore, while the composition of current assets changed materially: trade receivables increased to Rs 749 crore, cash reached Rs 171 crore and inventories remained close to Rs 341 crore.
The disclosed item to watch is the deployment of the Rs 620 crore fresh IPO issue. Management states that return ratios will reflect the pace at which proceeds are deployed into growth, while the SPOT business remains constrained by deployable working capital and bullion prices affect the volumes that capital can purchase.