










CENTUM’s H1 profit included Rs 94.3 crore from discontinued ops
Key highlights
- CENTUM’s H1-FY27 consolidated PAT was Rs 128.4 crore, including Rs 94.3 crore from discontinued operations.
- Continuing-operations PAT rose 4.0% to Rs 34.1 crore as operational revenue increased 37.5% to Rs 516.2 crore.
- CENTUM’s consolidated H1-FY27 EBITDA margin declined 231 basis points to 12.24%.
- CENTUM disclosed a H1-FY27 standalone order book of Rs 1,952.2 crore, including Rs 958.7 crore of BTS and Rs 993.5 crore of EMS.
powered by IRIS
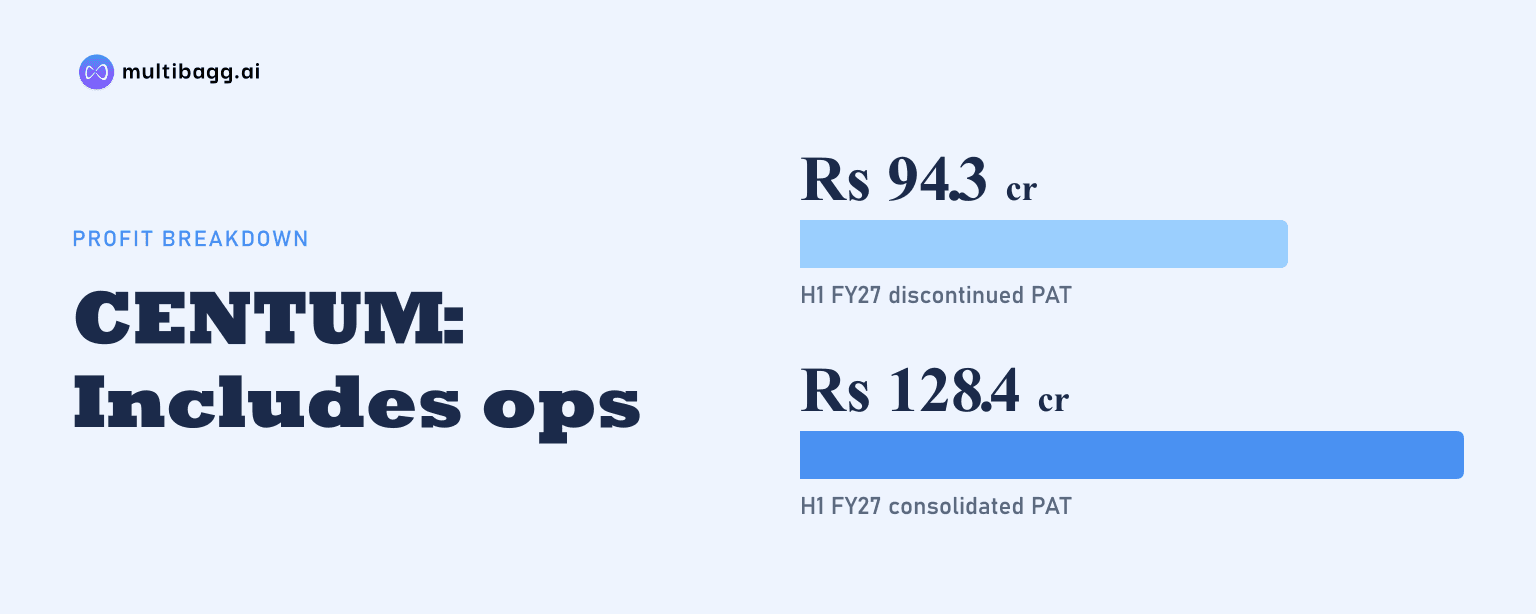
CENTUM reported consolidated profit after tax of Rs 128.4 crore in H1-FY27, including Rs 94.3 crore of profit after tax from discontinued operations; profit from continuing operations was Rs 34.1 crore, up 4.0% year on year despite 37.5% growth in operational revenue.
Know Centum Electronics inside out
Results, valuation, peers and who's buying, in one view.
What drove CENTUM’s H1-FY27 consolidated profit?
CENTUM’s reported H1-FY27 consolidated profit after tax, or PAT, was Rs 128.4 crore, compared with Rs 8.6 crore in H1-FY26. The principal driver was Rs 94.3 crore of PAT from discontinued operations, versus a Rs 24.2 crore loss from those operations in the previous first half. This swing accounts for the large movement in the headline profit figure.
Continuing operations generated Rs 34.1 crore of PAT in H1-FY27, compared with Rs 32.8 crore a year earlier. The continuing-business increase was therefore Rs 1.3 crore, or 4.0%, rather than the larger movement in total consolidated PAT. Total comprehensive income was Rs 129.3 crore in H1-FY27, against Rs 6.9 crore in H1-FY26, after other comprehensive income of Rs 90 lakh and a negative Rs 1.7 crore, respectively.
The presentation separately identifies the Rs 94.3 crore discontinued-operations profit but does not state the transaction, business or accounting event that produced it. It also reports no exceptional items in either H1-FY27 or H1-FY26 in the consolidated half-yearly statement. The disclosure therefore separates this contribution from continuing operations without giving a further explanation for the amount.
How did CENTUM’s continuing operations perform in H1-FY27?
CENTUM’s continuing operations increased operational revenue to Rs 516.2 crore in H1-FY27 from Rs 375.3 crore in H1-FY26, a 37.5% rise. Earnings before interest, tax, depreciation and amortisation, or EBITDA, increased 15.8% to Rs 63.2 crore from Rs 54.6 crore. Revenue therefore grew faster than EBITDA during the half year.
Total expenses rose 41.3% to Rs 453 crore, exceeding the revenue growth rate, while EBITDA margin declined by 231 basis points to 12.24% from 14.55%. A basis point equals one-hundredth of a percentage point. The presentation does not display a separate continuing-operations PAT margin, while the 24.87% consolidated PAT margin includes the discontinued-operations profit.
Other income declined 17.5% to Rs 4.7 crore, depreciation increased 19.1% to Rs 11.2 crore and finance cost rose 28.6% to Rs 9.9 crore. Profit before tax from continuing operations rose 8.3% to Rs 46.8 crore from Rs 43.2 crore, while tax increased 22.1% to Rs 12.7 crore. These changes left continuing-operations PAT 4.0% higher at Rs 34.1 crore.
Got a follow-up? Ask IRIS
Why does CENTUM’s quarterly result matter for H1 profit?
CENTUM recorded its Rs 94.3 crore discontinued-operations profit in Q1-FY27 rather than Q2-FY27, according to the quarterly consolidated statement. Q1-FY27 included Rs 94.3 crore from discontinued operations and total PAT of Rs 105.5 crore, while Q2-FY27 reported no discontinued-operations profit and PAT of Rs 22.9 crore. The half-year total was therefore concentrated in the first quarter.
Continuing operations improved in both reported Q2 comparisons. Q2-FY27 operational revenue was Rs 312.1 crore, up 58.7% from Rs 196.7 crore in Q2-FY26 and 52.9% from Rs 204.1 crore in Q1-FY27. Q2 PAT from continuing operations was Rs 22.9 crore, up 51.7% year on year from Rs 15.1 crore and above Rs 11.2 crore in Q1-FY27.
Q2-FY27 EBITDA margin was 12.72%, compared with 13.47% in Q2-FY26, a decline of 75 basis points. It was, however, 116 basis points above Q1-FY27’s 11.56%. The quarterly figures show sequential improvement in continuing profitability in Q2, although reported H1 PAT remains shaped by the discontinued-operations amount recorded in Q1.
What operating indicators did CENTUM disclose alongside earnings?
CENTUM disclosed a standalone order book of Rs 1,952.2 crore in H1-FY27, compared with Rs 1,644.8 crore in FY26. The segment labelled BTS accounted for Rs 958.7 crore and the segment labelled EMS accounted for Rs 993.5 crore. The presentation says BTS orders are typically executed over 25 to 30 months, while EMS orders are executed over nine to 12 months and exclude customer forecasts.
On the standalone income statement, H1-FY27 operational revenue was Rs 516.8 crore and PAT was Rs 36.3 crore, slightly above the consolidated continuing-operations figures of Rs 516.2 crore and Rs 34.1 crore. Standalone EBITDA margin was 12.11%, down 72 basis points from 12.83% in H1-FY26. Standalone PAT margin declined 25 basis points to 7.02%.
CENTUM also reported standalone total borrowings to equity of 0.29 times in H1-FY27, compared with 0.28 times in FY26 and 0.17 times in FY25. Adjusted net working-capital days were 142 in FY26, down from 159 in FY25 and close to 141 in FY24. These measures appear in standalone financial highlights and are not presented as consolidated H1-FY27 measures.
Conclusion
CENTUM’s H1-FY27 consolidated PAT of Rs 128.4 crore combined Rs 34.1 crore from continuing operations with Rs 94.3 crore from discontinued operations. Continuing operational revenue rose 37.5% to Rs 516.2 crore, but EBITDA increased 15.8%, EBITDA margin fell to 12.24%, and continuing PAT rose 4.0%. The headline PAT movement therefore does not, on its own, describe the half-year trend in continuing operations.
The next disclosures to watch are any explanation of the Rs 94.3 crore discontinued-operations profit, which the presentation does not identify, and execution of the Rs 1,952.2 crore standalone order book. The presentation assigns typical execution periods of 25 to 30 months for BTS orders and nine to 12 months for EMS orders, while Q2-FY27 showed sequential improvement in continuing revenue, EBITDA margin and PAT.