










CENTUM standalone revenue rises 54% as margin holds near 12%
Key highlights
- CENTUM standalone revenue increased from Rs 632.8 crore in FY24 to Rs 973.1 crore in FY26.
- CENTUM’s standalone EBITDA margin was 12.42% in FY26, compared with 12.44% in FY24.
- Exceptional items of Rs 203.3 crore resulted in a FY26 standalone loss after tax of Rs 117.1 crore.
- CENTUM reported H1-FY27 standalone profit after tax of Rs 36.3 crore as inventories reached Rs 538.1 crore.
powered by IRIS
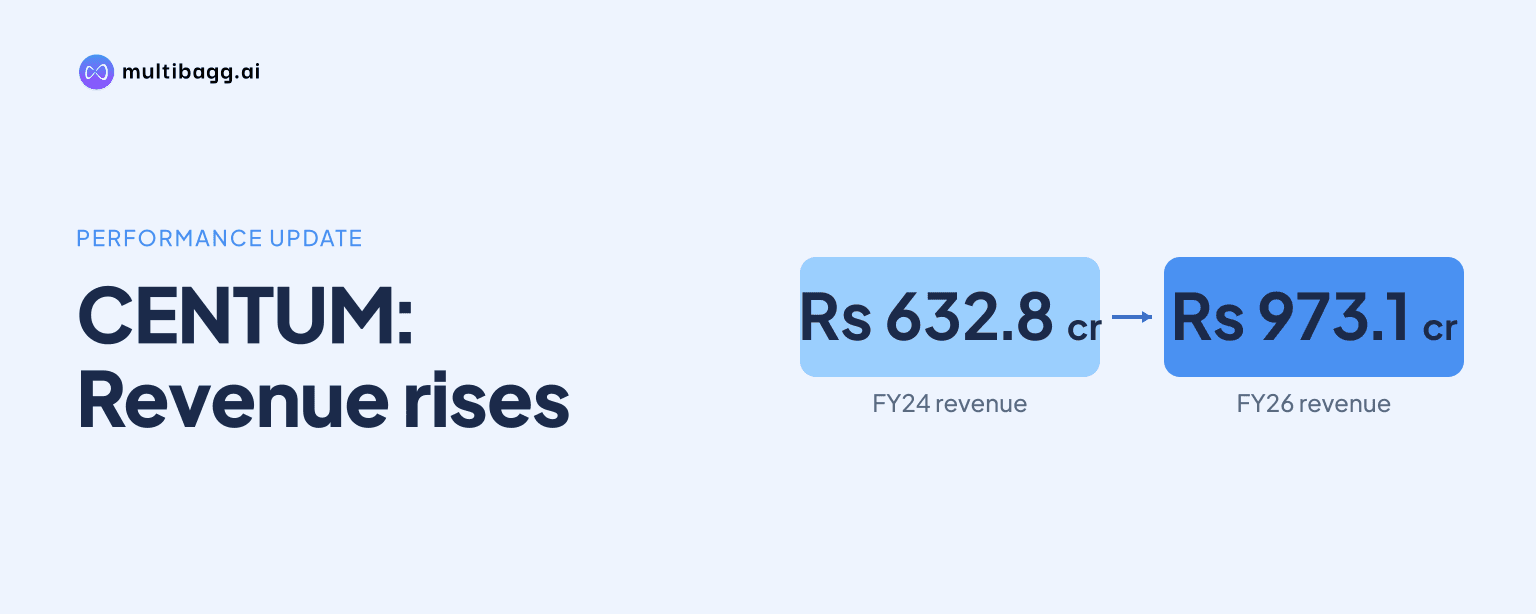
CENTUM’s standalone operational revenue increased 54% from Rs 632.8 crore in FY24 to Rs 973.1 crore in FY26, while EBITDA margin was 12.42% in FY26 versus 12.44% in FY24. A Rs 203.3 crore exceptional item, however, converted FY26 pre-exceptional profit before tax of Rs 100.4 crore into a Rs 102.9 crore loss before tax.
Know Centum Electronics inside out
Results, valuation, peers and who's buying, in one view.
How fast did CENTUM's standalone revenue grow?
CENTUM’s standalone operational revenue rose by Rs 340.3 crore over FY24 to FY26, increasing from Rs 632.8 crore to Rs 776.1 crore in FY25 and Rs 973.1 crore in FY26. EBITDA, or earnings before interest, tax, depreciation and amortisation, grew from Rs 78.7 crore in FY24 to Rs 94.1 crore in FY25 and Rs 120.9 crore in FY26.
CENTUM’s EBITDA margin changed little despite the revenue expansion. The margin was 12.44% in FY24, 12.12% in FY25 and 12.42% in FY26, leaving FY26 only 0.02 percentage points below the FY24 level. Total expenses increased from Rs 554.1 crore in FY24 to Rs 852.2 crore in FY26, compared with the Rs 340.3 crore rise in operational revenue.
CENTUM’s disclosed standalone revenue mix as on H1-FY27 was led by India at 46%, followed by North America and rest of world at 31% and Europe and the United Kingdom at 23%. Defence, Space and Aerospace was the largest industry vertical at 48%, while Semiconductor represented 17% and Transportation and Automotive and Industry and Energy each represented 12%.
What caused CENTUM's FY26 standalone loss?
CENTUM reported a standalone loss after tax of Rs 117.1 crore in FY26 because it recorded exceptional items of Rs 203.3 crore, despite generating Rs 100.4 crore of profit before exceptional items and tax. The standalone income-statement table does not identify the nature of that exceptional item.
The charge changed profit before tax from a Rs 61.7 crore profit in FY25 to a Rs 102.9 crore loss in FY26. Profit after tax margin consequently moved from 5.88% in FY25 to negative 12.04% in FY26, even as the EBITDA margin increased by 0.30 percentage points to 12.42%.
Other income increased from Rs 6.6 crore in FY25 to Rs 15.8 crore in FY26, while finance cost fell from Rs 19.5 crore to Rs 16.8 crore. Depreciation was unchanged at Rs 19.5 crore in both years. These movements did not offset the Rs 203.3 crore exceptional charge, and diluted earnings per share moved from Rs 34.84 in FY25 to Rs (79.32) in FY26.
Got a follow-up? Ask IRIS
Did CENTUM report standalone profitability in H1-FY27?
CENTUM reported standalone profit after tax of Rs 36.3 crore in H1-FY27, compared with a loss after tax of Rs 117.1 crore in FY26. H1-FY27 operational revenue was Rs 516.8 crore and EBITDA was Rs 62.6 crore, producing a 12.11% EBITDA margin and a 7.02% profit-after-tax margin.
CENTUM recorded exceptional items of Rs 2.8 crore in H1-FY27, lifting profit before tax from Rs 46.2 crore before exceptional items and tax to Rs 49.0 crore. Tax expense was Rs 12.7 crore, while diluted earnings per share was Rs 24.62. The H1-FY27 profit after tax matched the Rs 36.3 crore reported for the full FY24 year.
H1-FY27 revenue represented 53.1% of FY26 revenue of Rs 973.1 crore, while H1 EBITDA represented 51.8% of FY26 EBITDA of Rs 120.9 crore. This is a comparison of a six-month period with a full year, not a FY27 forecast, and the presentation provides no quantified FY27 revenue or margin target.
How did CENTUM's balance sheet and working capital change?
CENTUM’s standalone inventories rose by Rs 81.3 crore from Rs 456.8 crore at FY26 to Rs 538.1 crore at H1-FY27. Current assets increased by Rs 91.2 crore to Rs 1,017 crore, while trade receivables rose by Rs 10.4 crore to Rs 317.7 crore and cash and cash equivalents declined by Rs 13.3 crore to Rs 24.5 crore.
CENTUM’s equity increased by Rs 28.7 crore between FY26 and H1-FY27 but remained below the Rs 558.5 crore reported in FY25. Current liabilities increased from Rs 667.5 crore at FY26 to Rs 714.1 crore at H1-FY27, including trade payables of Rs 259.7 crore and other current liabilities of Rs 297.8 crore. Non-current borrowings rose from Rs 2.2 crore to Rs 26.3 crore.
CENTUM describes Build-to-Specification, or BTS, as its value engine, with a benchmark margin above 20%, project cycles of 2 to 2.5 years and 225 to 350 working-capital days. Its Electronic Manufacturing Services, or EMS, business has a stated benchmark margin of 9% to 10%, project cycles of six to nine months and 85 to 110 working-capital days. Management describes EMS as the majority of revenue and as funding BTS’s longer project and working-capital cycles.
Conclusion
CENTUM’s standalone disclosures show revenue rising from Rs 632.8 crore in FY24 to Rs 973.1 crore in FY26 while EBITDA margin remained within a narrow 12.12% to 12.44% range. The FY26 reported loss was driven by the separately disclosed Rs 203.3 crore exceptional item rather than a decline in stated EBITDA margin, and H1-FY27 reported profit after tax of Rs 36.3 crore.
The next disclosures will show whether the H1-FY27 inventory increase to Rs 538.1 crore translates into revenue, earnings and cash generation. Management’s stated plan is to develop and localise critical BTS technologies for defence and strategic sectors while expanding EMS activity in domestic manufacturing, semiconductor equipment, security systems, energy, automotive and medical devices; the presentation does not disclose a quantified FY27 target.