










CERA converts 117% of EBITDA into operating cash flow
Key highlights
- CERA reported Rs 143 crore of operating cash flow, equal to 117% of EBITDA.
- CERA’s net working-capital days fell to 58 in September 2026 from 77 in September 2025.
- CERA’s cash and cash equivalents increased Rs 161 crore to Rs 897 crore at September 2026.
- CERA’s H1 FY27 revenue rose 23.7% to Rs 1,089 crore while EBITDA margin declined to 11.3%.
powered by IRIS
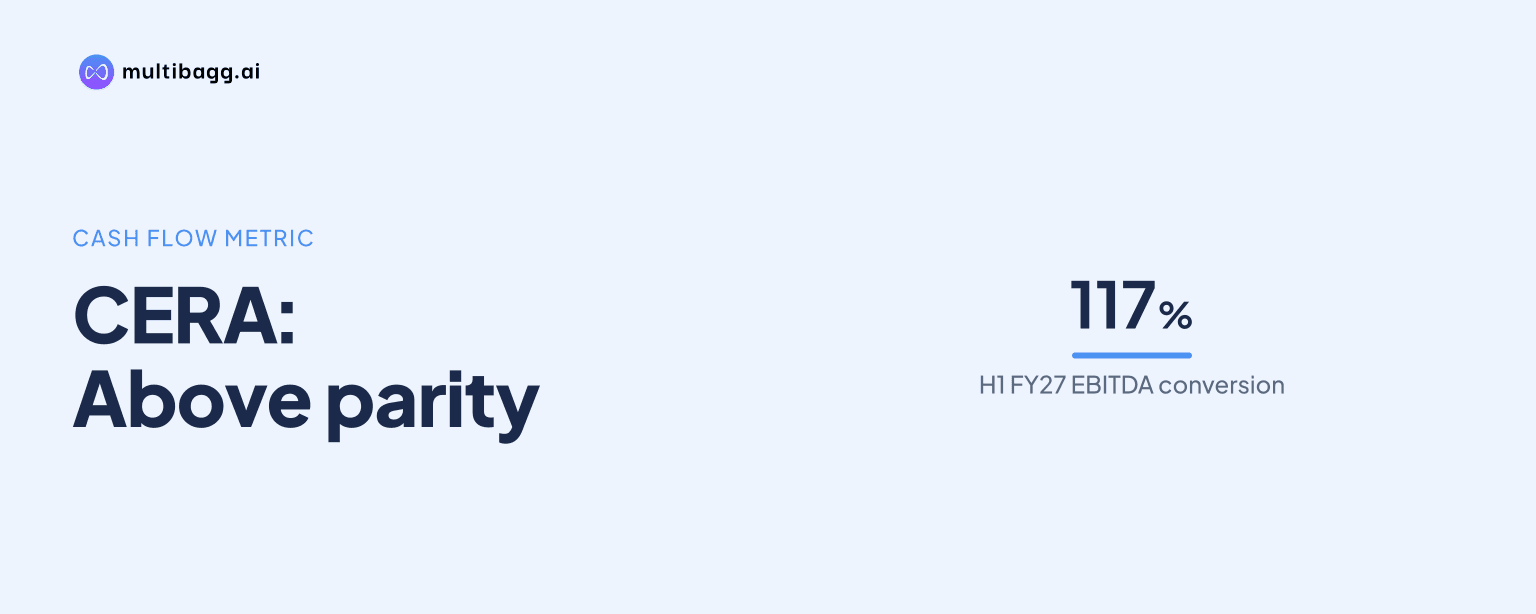
CERA reported Rs 143 crore of cash flow from operations, equal to 117% of EBITDA, while net working-capital days fell to 58 in September 2026 from 77 a year earlier. Cash and cash equivalents rose Rs 161 crore to Rs 897 crore, even as net working capital increased to Rs 1,184 crore.
Know Cera Sanitaryware inside out
Results, valuation, peers and who's buying, in one view.
How did CERA convert EBITDA into operating cash flow?
CERA reported operating cash flow, or OCF, of Rs 143 crore and an OCF-to-EBITDA ratio of 117% in its September 2026 balance-sheet and cash-position disclosure. EBITDA means earnings before interest, tax, depreciation and amortisation; CERA calculates this measure without other income. The reported ratio means OCF exceeded the EBITDA measure used for the calculation.
The presentation does not provide a cash-flow bridge for the Rs 143 crore OCF figure, including movements in inventory, receivables, payables, taxes, capital expenditure or financing flows. It also does not separately label the OCF measurement period. However, CERA reported H1 FY27 EBITDA of Rs 122 crore, up from Rs 120 crore in H1 FY26, while revenue from operations rose Rs 209 crore to Rs 1,089 crore.
CERA’s cash conversion disclosure came during a period of lower operating margins. H1 FY27 EBITDA margin was 11.3%, compared with 13.7% in H1 FY26, while Q2 FY27 EBITDA was Rs 73 crore, up from Rs 67 crore in Q2 FY26. The OCF result therefore occurred alongside revenue growth but a lower margin than in the comparable periods.
What changed in CERA’s working capital at September 2026?
CERA reduced net working-capital days by 19 days to 58 at September 2026, from 77 at September 2025, although absolute net working capital rose Rs 109 crore to Rs 1,184 crore. The day measure shows working-capital intensity relative to business activity, while the rupee balance shows the amount reported at the balance-sheet date.
The lower day count coincided with higher sales. Revenue from operations was Rs 603 crore in Q2 FY27, versus Rs 473 crore in Q2 FY26, an increase of 27.4%. H1 FY27 revenue reached Rs 1,089 crore, compared with Rs 880 crore a year earlier, up 23.7%; the presentation does not provide an inventory, receivables and payables split for the Rs 1,184 crore working-capital balance.
CERA identifies working-capital discipline as an FY27 priority, with continued attention to inventory and cash-flow efficiency. This stated focus follows the reduction to 58 days despite the Rs 1,184 crore net working-capital balance. Management has not disclosed a further numerical target for working-capital days.
Got a follow-up? Ask IRIS
Why did CERA’s cash balance rise as margins declined?
CERA’s cash and cash equivalents rose to Rs 897 crore at September 2026 from Rs 736 crore a year earlier, while Q2 FY27 EBITDA margin declined to 12.2% from 14.2% in Q2 FY26. Q2 revenue grew 27.4% to Rs 603 crore, whereas EBITDA increased 9.1% to Rs 73 crore, showing that revenue growth exceeded EBITDA growth in the quarter.
Input costs were a stated factor in the margin movement. CERA said brass and gas costs increased by about 58% and 42% year on year, respectively, and its Q2 FY27 gross margin was 44.0%, down from 49.2% in Q2 FY26. Weighted-average gas cost was ₹47.3 per standard cubic metre, and gas represented 4.0% of Q2 FY27 revenue.
Q2 FY27 EBITDA margin improved 210 basis points from 10.1% in Q1 FY27, but remained 200 basis points below the prior-year quarter. Profit after tax was Rs 56 crore in Q2 FY27, compared with Rs 57 crore in Q2 FY26. Fixed assets changed modestly, rising to Rs 389 crore in September 2026 from Rs 384 crore in September 2025, while the presentation does not reconcile the cash increase across operating, investing and financing activities.
Which businesses supported CERA’s Q2 FY27 revenue growth?
CERA’s sanitaryware and faucetware segments grew 24% and 38% year on year, respectively, in Q2 FY27. Sanitaryware accounted for 45% of quarterly revenue mix and faucetware for 43%, leaving the two core categories at 88% of the revenue base. Tiles represented 10% and wellness represented 2%.
Faucetware capacity utilisation was 107% in Q2 FY27, compared with 97% in Q2 FY26, while sanitaryware utilisation declined to 82% from 85%. CERA said faucetware capacity expansion was on track during FY27. These operating measures accompany management’s objective of pursuing volume-led growth while maintaining working-capital discipline.
Retail accounted for 61% of Q2 FY27 revenue, with projects at 39%. Premium products made up 43% of revenue, mid-market products 37% and entry products 20%. CERA said it implemented a faucetware price revision in September and operates a monthly brass-price pass-through mechanism to address input-price movements.
Management maintained its FY27 revenue-growth outlook of 18% to 20% and EBITDA-margin outlook of 13% to 14%. Management expects profitability to improve progressively in the second half through pricing actions and cost-efficiency initiatives. The reported H1 FY27 EBITDA margin was 11.3%, compared with the stated full-year outlook range.
Conclusion
CERA’s September 2026 disclosure shows improved cash conversion and lower working-capital intensity alongside a higher cash balance. OCF of Rs 143 crore, equal to 117% of EBITDA, and the 19-day reduction in working-capital days contrast with a Rs 109 crore rise in absolute working capital as H1 FY27 revenue increased 23.7% to Rs 1,089 crore.
What to watch next is management’s delivery against its FY27 outlook of 18% to 20% revenue growth and a 13% to 14% EBITDA margin. CERA also plans faucetware capacity expansion during FY27 and has identified inventory and cash-flow efficiency as priorities, while brass and gas costs remain relevant to its stated expectation of improving second-half profitability.